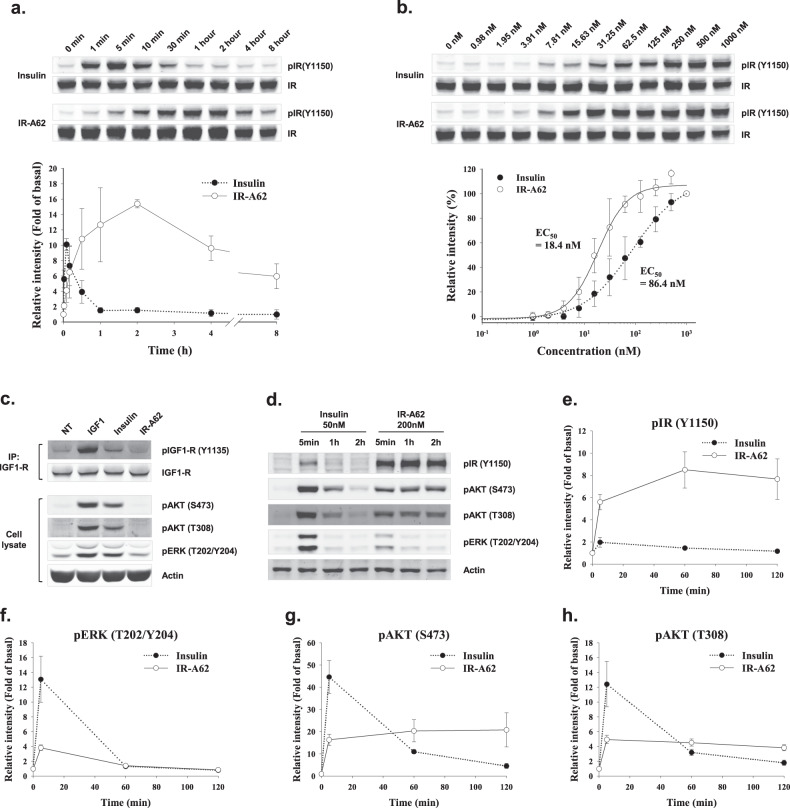
Fig. 4. Effects of the dose and duration of treatment with IR-A62 on IR Y1150 phosphorylation and downstream signaling.
a IR Y1150 phosphorylation was measured following the incubation of Rat-1/hIR cells with 100 nM insulin or 100 nM IR-A62 for 1 min, 5 min, 10 min, 30 min, 1 h, 2 h, 4 h, or 8 h. The relative band intensities are presented as the mean ± standard deviation of two independent replicates. b Rat-1/hIR cells were incubated with various concentrations of insulin for 5 min or IR-A62 for 1 h. The relative band intensities are presented as the mean ± standard deviation of two independent replicates. To determine the EC50, the data were fitted to a four-parameter logistic equation. g HeLa cells were incubated with 50 nM insulin-like growth factor-1 for 10 min, 100 nM insulin for 10 min, or 1 µM IR-A62 for 1 h. IGF-1R was then immunoprecipitated to assess its phosphorylation. d Fully differentiated 3T3-L1 adipocytes were incubated with 50 nM insulin or 200 nM IR-A62 for 5 min, 1 h, or 2 h. The phosphorylation kinetics of e IR Y1150, f extracellular signal-related kinase (ERK) T202/Y204, g AKT S473, and h AKT T308 are presented as the mean ± standard deviation of three independent replicates.

