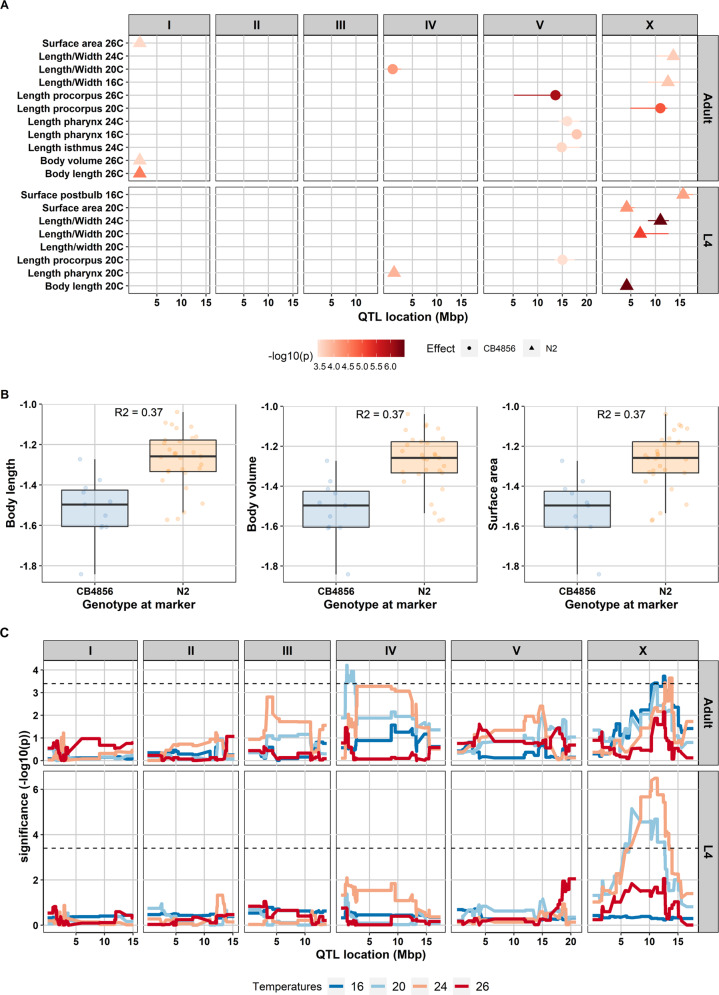
Fig. 3. Quantitative trait locus mapping of body-size traits in four temperature regimes.
A QTLs found for body-size traits in the 40 RILs. The x-axis represents the position of the QTL in mega base pairs (Mbp) for each chromosome and y-axis displays the corresponding significant QTL from a single marker model. In total, 18 QTL were found with –log10(p) score ranging from 3.44 to 6.49 (–log10(p) threshold 3.4, FDR = 0.05). Shapes represent genotype effect: dots = CB4856; triangles = N2. Horizontal lines in the QTL spots represent confidence interval. B Allelic effects of QTL for body length, body volume, and surface area of the nematode in adult stage at 26 °C at the peak marker location. RILs that have N2 marker at this locus relatively have a bigger body size compared to those that have CB4856 marker. The genetic variation on chromosome I can explain 30–37% of the variation in body length, body volume, and surface nematode at that condition. C QTL profile of length/width ratio. The QTL analysis was performed across four temperatures (16, 20, 24, 26 °C) and two developmental stages (L4 and adult) using a single marker model. X-axis displays genomic position in the chromosome corresponding to the box above the line while y-axis represents the –log10(p) score. Box in the right graph shows the developmental stages. Blue line represents QTL at 16 °C, light blue line at 20 °C, orange line at 24 °C, and red line at 26 °C. Black-dash line represents –log10(p) threshold (FDR = 0.05).

