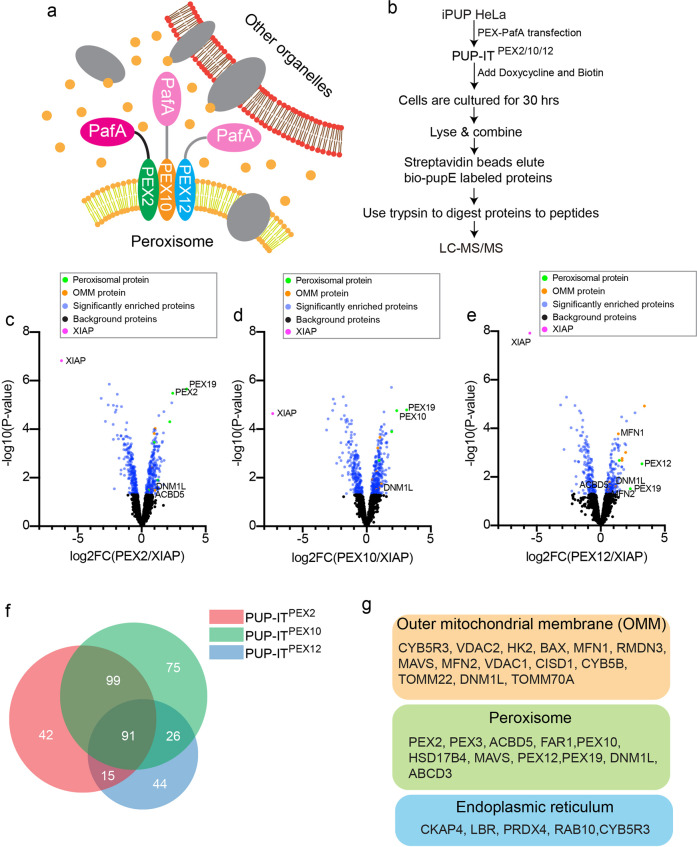
Fig. 1. Identification of PEX2/10/12 interacting proteins by PUP-IT.
a Schematic view of the PUP-IT design to identify PEX2/10/12 proximity proteins. PafA was fused to one of the PEX proteins, co-expressed with bio-PupE (yellow dots), and mediates bio-PupE modifications on proximal proteins. b The experimental workflow. The iPUP HeLa cells were transfected with PEX2-PafA, PEX10-PafA, and PEX12-PafA, respectively, to generate PUP-IT PEX2, PUP-ITPEX10, and PUP-ITPEX12 HeLa cells. The proximity labeling was induced in 2 × 10⁷ cells by the addition of doxycycline (2 μg/ml) and biotin (4 μM) for 30 h. Cells were lysed, and bio-PupE modified proteins were enriched and identified by mass spectrometry. c–e Volcano plots of PUP-ITPEX2, PUP-ITPEX10, and PUP-ITPEX12-interacting proteins. The logarithmic ratios of protein label-free quantification intensity (PEX/XIAP) were plotted against negative logarithmic P values in the limma package. Limma-based t-test was used for significant difference testing of data. The candidate proteins were determined by a moderated t-test (P-value < 0.05) and fold change (fold change > 1.3). The blue dots represent significantly enriched proteins (false discovery rate ≤ 0.05; n = 3 independent experiments). The right arm comprises proteins that are proximal to peroxisomes, the left arm proteins proximal to XIAP. Yellow dots represent outer mitochondrial membrane (OMM) proteins. Green dots represent peroxisomal proteins. The magenta dot represents XIAP. f Analysis of significantly enriched proteins in three datasets (PUP-ITPEX2, PUP-ITPEX10, and PUP-ITPEX12) through Venn diagram. The data were analyzed with BioVenn41. g Subsets of proteins identified with proximity labeling include OMM proteins, peroxisomal proteins, and ER proteins. Other proteins are not shown but included in the Supplementary Data 1. Protein localization was assigned based on Uniprot and MitoCarta 3.042.

