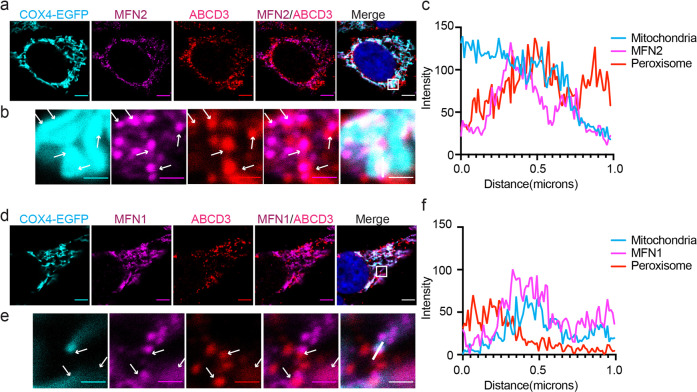
Fig. 5. Endogenous mitofusins locate on the mitochondrion-peroxisome contacting sites.
a Immunofluorescence images of endogenous MFN2. Confocal microscopy analysis of HeLa cells expressing COX4-EGFP (mitochondria), immunostained for MFN2 (Alexa Fluor 555) and peroxisomal protein ABCD3 (Alexa Fluor 647). Scale bars: 5 μm. b The zoomed-in images of the white box in (a). White arrows point the places where ABCD3 overlaps with MFN. Scale bars: 1 μm. c Histograms display measured fluorescence intensity along the white line in the merge panels in b, with the cyan line represents mitochondria, the magenta line represents endogenous MFN2, and the red line represents peroxisome. d–f Immunofluorescence images and analysis of endogenous MFN1. Similar experiments were performed as in (a–c).

