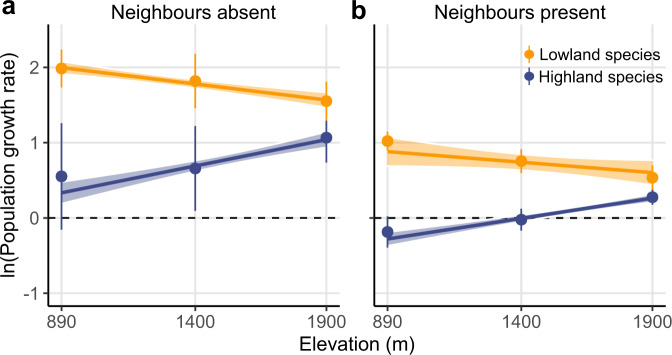
Fig. 1. Population growth rates across the elevation gradient.
Population growth rates (λ) of lowland (orange) and highland (blue) species across the elevation gradient when neighbours are absent (a; n = 7 at each elevation for lowland species, n = 6, 7, and 7 for highland species at the low, middle, and high elevations, respectively) and present (b; n = 51, 51, and 56 for lowland species, and n = 40, 48, and 54 for highland species at the low, middle, and high elevations, respectively). Populations are predicted to persist when ln(λ) > 0 (dashed horizontal line). The points and error bars represent the averages and standard errors across species at each site. Solid lines show significant relationships (test based on the mean of 500 bootstrap replicates; P < 0.05; Supplementary Table 4). Shading indicates 95% confidence intervals for the regressions derived from bootstrap replicates of the dataset (N = 500 bootstraps), indicating the propagated uncertainty in the relationships resulting from model parametrization (see Methods). Source data are provided as a Source Data file.

