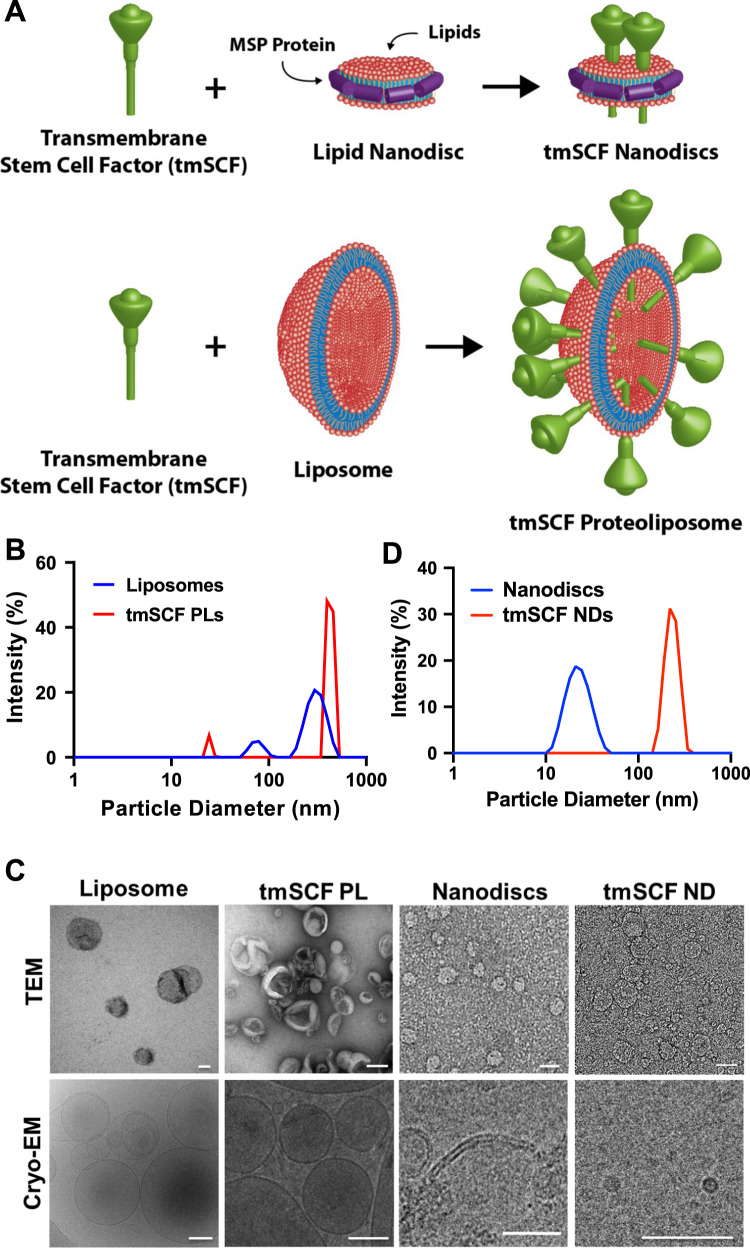
Fig. 1. Characterization of tmSCFPLs and tmSCFNDs by DLS and electron microscopy.
A Schematic illustration of tmSCF proteoliposomes (tmSCFPLs) and tmSCF nanodiscs (tmSCFNDs). B Size distribution for liposomes and proteoliposome with tmSCF measured by dynamic light scattering. C Size distribution for nanodiscs and tmSCF nanodiscs. D Representative TEM and cryo-EM images of liposomes, tmSCFPLs, nanodiscs, and tmSCFNDs. Scale bar = 100 nm.

