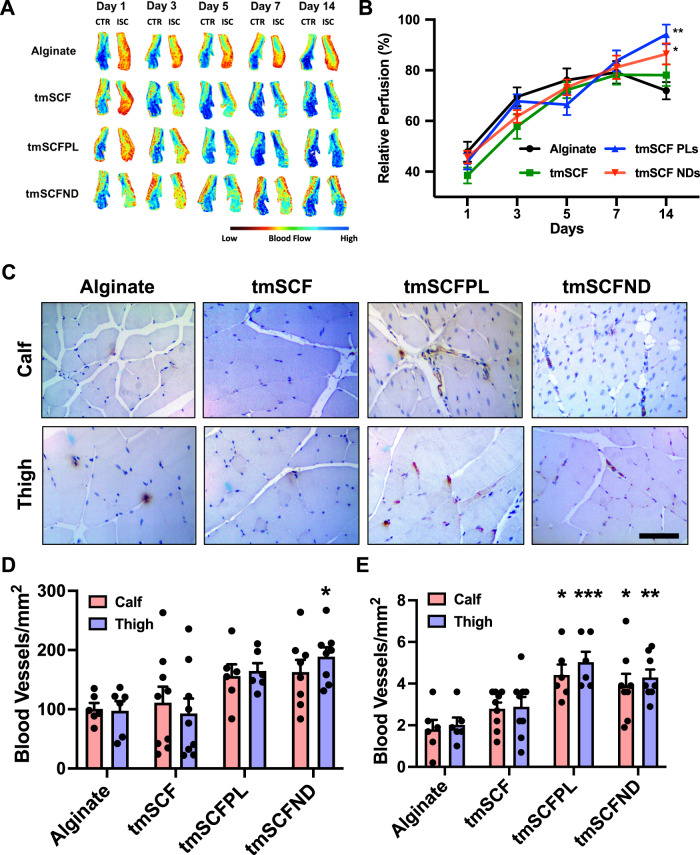
Fig. 3. Evaluation of treatments in a hindlimb ischemia model on wild type mice.
A Representative mice foot images taken by laser speckle imaging. B Relative blood flow recovery after hind limb ischemia surgery on WT mice (n = 13 for tmSCFND, 12 for other groups). p = 0.006 (tmSCFPL vs control) and p = 0.037 (tmSCFND vs control) * indicates p value < 0.05 **p < 0.01. C Immunostaining for PECAM on mice on the muscles from the ischemic calf and thigh muscle of the mice after 14 days. Scale bar = 100 µm. D Quantification small blood vessels in the calf and thigh muscle counted from PECAM immunostaining images (n = 7 for tmSCF, 4 for other groups). *p = 0.0116 on tmSCFND vs alginate. E The number of large blood vessels in the tissues (n = 7 for tmSCF, 4 for other groups). p = 0.043 on tmSCFPL vs control and p = 0.0295 on tmSCND vs control on calf muscle. p = 0.0005 on tmSCFPL vs control and p = 0.0038 on tmSCFND vs control on thigh muscle. Two-sided one-way ANOVA with Dunnett’s post hoc test was used. * indicates p value < 0.05, ** < 0.01, and *** <0.001. All the error bars are SEM.

