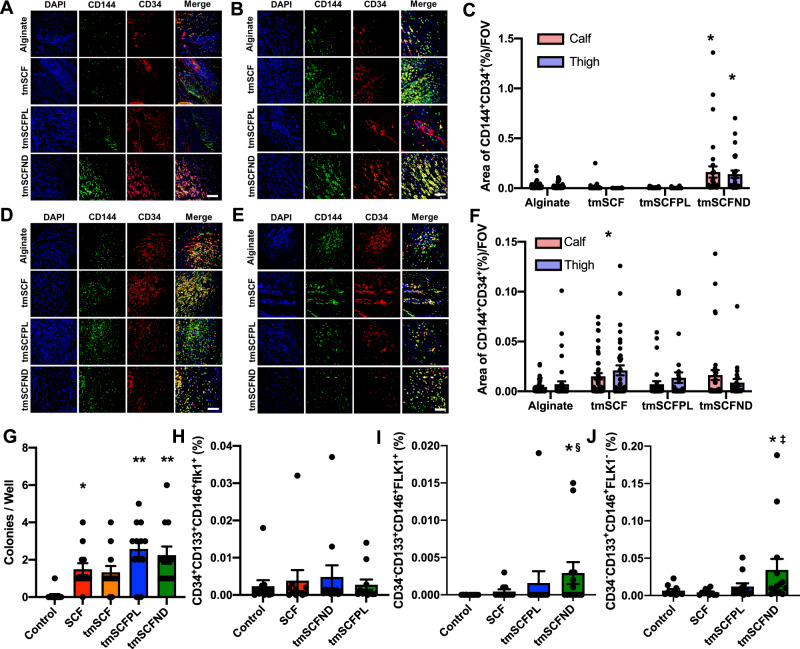
Fig. 5. EPCs are recruited to peripheral blood and ischemic site.
A, B Representative immunostaining images of CD34 (red) and CD144 (green) on WT mice calf and thigh muscle, respectively. Scale bar is 300 µm. C CD34 and CD144 double positive areas were quantified in WT mice (n = 3 for alginate and tmSCF, 4 for tmSCFPL and tmSCFND). **p < 0.01 versus control (D, E). Representative immunostaining images of CD34 (red) and CD144 (green) on ob/ob mice calf and thigh muscle, respectively. Scale bar is 300 µm. F CD34 and CD144 double positive areas were quantified in ob/ob mice (n = 3 for tmSCFPL, 4 for alginate and tmSCFND, and 5 for tmSCF). **p < 0.01 versus control. G Average large EPC colony number per well (n = 12). H Frequency of CD34+CD133+CD146+FLK1+ cells in peripheral blood after subcutaneous injection (n = 11 for alginate, SCF and tmSCFPL, and 12 for tmSCFND). I Frequency of CD34−CD133+CD146+FLK1+ cells in peripheral blood after subcutaneous injection (n = 11 for alginate, SCF and tmSCFPL, and 12 for tmSCFND). p = 0.0454 (tmSCFND vs control) and p = 0.00302 (tmSCFND vs SCF). J Frequency of CD34−CD133+CD146+FLK1− cells in peripheral blood after subcutaneous injection (n = 10 for alginate, 11 for SCF, 12 for tmSCFPL and 14 for tmSCFND). p = 0.0314 (tmSCFND vs control) and p = 0.0031 (tmSCFND vs SCF). *, †, ‡ and § indicate significant difference over alginate control, tmSCF, tmSCFPL, and SCF, respectively (p < 0.05; Kruskal–Wallis; one-way analysis of variance). All the error bars are SEM.

