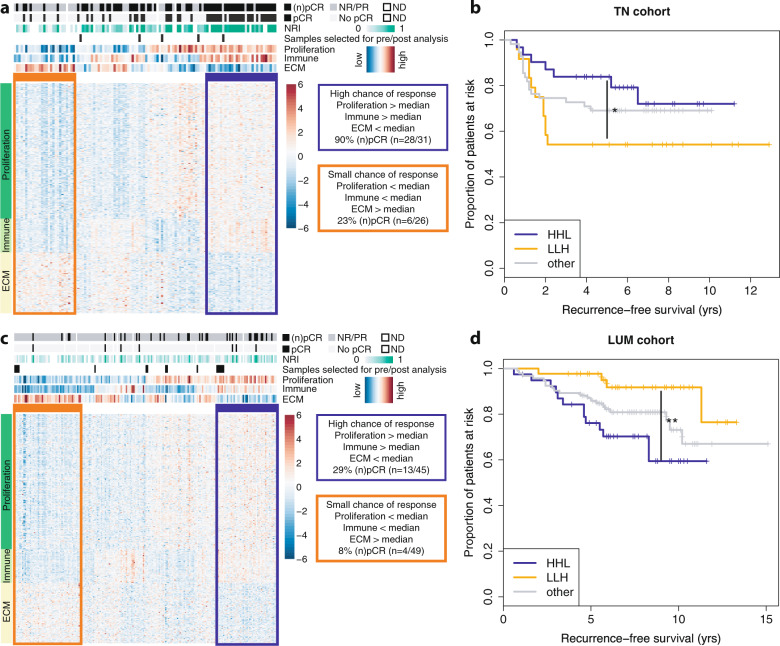
Fig. 1. Biological processes associated with response to neoadjuvant chemotherapy.
a Heatmap of expression levels of genes associated with response to neoadjuvant chemotherapy in triple negative breast cancer patients. Cases are in columns, genes in rows. Biological processes associated with the genes in this heatmap are indicated on the left; patient and sample information are indicated on the top: top track indicates treatment response in the breast; second and third tracks indicate treatment response in the breast and lymph nodes. The three bottom tracks indicate the average gene expression level of the genes associated with proliferation, immune response and ECM. The orange and blue boxes respectively indicate the gene expression profiles of poor and good responders. Black bars at the bottom indicate which samples were included in the pre/post chemotherapy analyses. ECM extracellular matrix, ND not determined, (n)pCR (near) pathological complete response, NRI neoadjuvant response index. b Kaplan–Meier curves showing recurrence-free survival in subgroups of triple negative patients as identified in (a). HHL (blue) High proliferation, High immune response, Low ECM, LLH (orange) Low proliferation, Low immune response, High ECM, and other combinations (gray). c Heatmap of expression levels of genes associated with response to neoadjuvant chemotherapy in ER+/HER2− breast cancer patients. Format is the same as in (a). d Kaplan–Meier curves showing recurrence-free survival in subgroups of ER+/HER2− patients as identified in (c). *p < 0.05; **p < 0.01 (Kaplan–Meier estimate).

