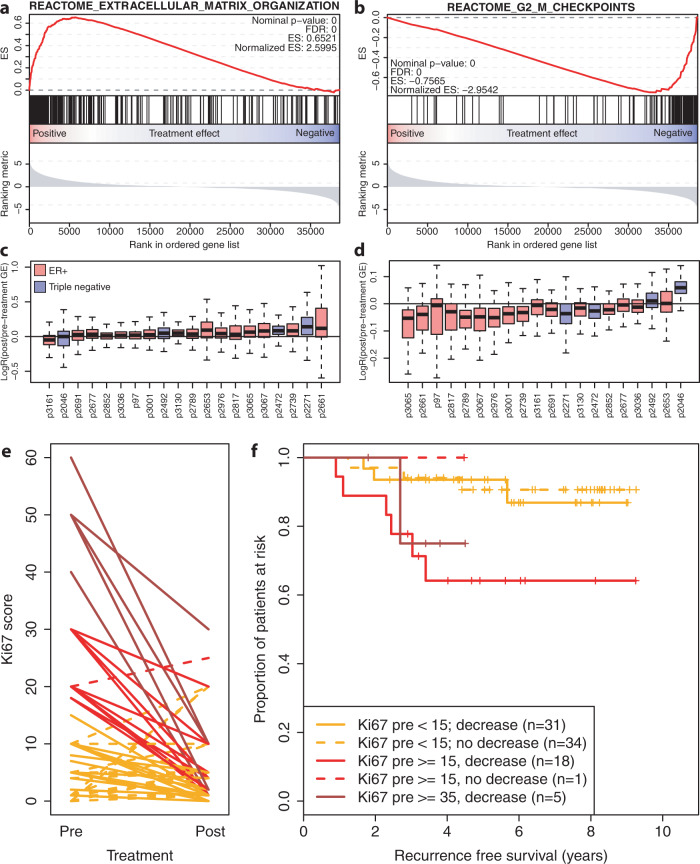
Fig. 2. Transcriptomic differences between breast tumors before and after chemotherapy.
a Gene set enrichment plot of genes involved in extracellular matrix organization according to the reactome database. Genes are ordered based on the differential gene expression analyses: genes on the right side of the plot are down-regulated upon treatment, whereas genes on the left are upregulated. FDR: False Discovery Rate, ES enrichment score. b Gene set enrichment plot of genes involved in the G-phase to M-phase checkpoint according to the reactome database. Layout is identical to (a). c Boxplots of log fold changes between pre- and post-treatment samples of the geneset shown in (a). Every box is one sample: red are ER+ samples, blue are triple negative. The box indicates the interquartile range, while lower and upper bars correspond to the minimum and maximum non-outlier values of the data distribution. Outliers are defined as values outside 1.5× the interquartile range from the box. The center line indicates the median value. d Boxplots of log fold changes between pre- and post-treatment samples of the geneset shown in (b). Every box is one sample: red boxes are ER+ samples, blue boxes are triple negative. Boxplots are constructed in the same manner as in (c). e Interaction plot showing the effect of chemotherapy on proliferation in ER+ samples, measured the percentage of cells positive for Ki67. In red are samples with a relatively high proliferation rate before treatment (Ki67 ≥ 15), in orange are samples with a low pre-treatment proliferation rate (Ki67 < 15). f Kaplan–Meier curves of the samples shown in (e).

