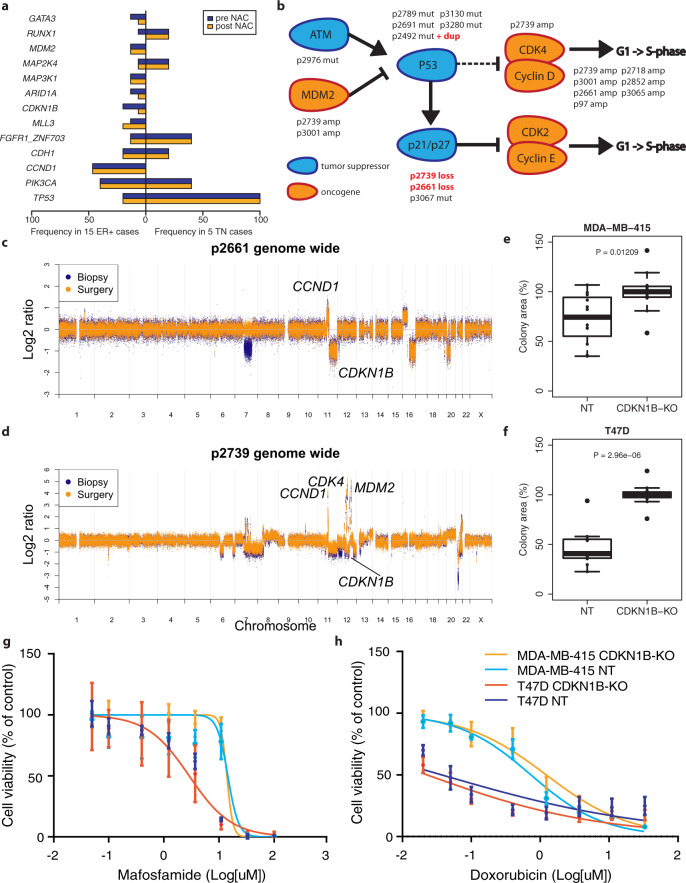
Fig. 3. Genomic differences between breast tumors before and after chemotherapy.
a Barplot of genes frequently aberrated in our cohort. Copy number changes and mutations are combined. In blue: frequency before treatment; orange: frequency after treatment. NAC neoadjuvant chemotherapy. b Simplified version of the cell cycle checkpoint pathway, highlighting genes aberrated in our cohort. Tumor suppressor genes are shown in blue, oncogenes in orange. Aberrated samples are indicated above/below the genes. Sample names in red indicate that the genetic aberration was not shared between the pre- and post-treatment sample. c Genome-wide copy number plot of patient s2661. Copy number changes of genes included in b are labeled. In blue, the copy number data of the pre-treatment sample; in orange, the post-treatment sample. d Genome-wide copy number plot of patient s2739. Layout is identical to (c). e Boxplots showing cell growth of MDA-MB-415 (CCND1 amplified) breast cancer cell lines, with (left) or without (right) functional CDKN1B. f Boxplots showing cell growth of T47D (CCND1 neutral) breast cancer cell lines, with (left) or without (right) functional CDKN1B. g Effect of CDKN1B knock-out on mafosfamide sensitivity in T47D (CCND1 neutral) and MDA-MB-415 (CCND1 amplified) breast cancer cell lines. Dark and lightblue: controls, red and orange: CDKN1B knock-out. h Effect of CDKN1B knock-out on doxorubicin sensitivity in T47D (CCND1 neutral) and MDA-MB-415 (CCND1 amplified) breast cancer cell lines. Dark and lightblue: controls, red and orange: CDKN1B knock-out. NT non-targeting control gRNA, KO knock-out with CDKN1B targeting gRNA. For box plots in this figure, the boxes indicate the interquartile range, while lower and upper bars correspond to the minimum and maximum non-outlier values of the data distribution. Outliers are defined as values outside 1.5× the interquartile range from the box. The center line indicates the median value.

