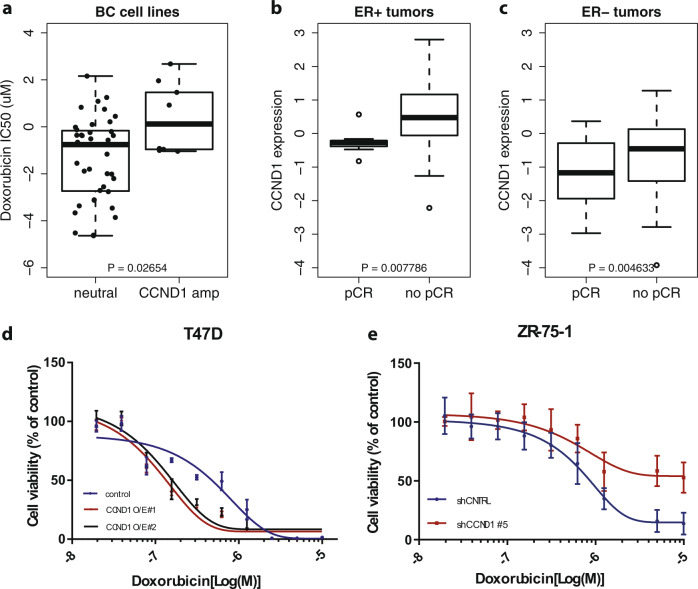
Fig. 4. Exploration of the effect of CCND1 amplification on chemotherapy sensitivity.
a Boxplots showing sensitivity to doxorubicin in CCND1 neutral (left) and amplified (right) breast cancer cell lines in the GDSC1000 database. b Boxplots showing the association between CCND1 gene expression levels and response to neoadjuvant doxorubicin + cyclophosphamide in ER+ tumors from our neoadjuvant cohort. pCR pathological complete response. c Boxplots showing the association between CCND1 gene expression levels and response to neoadjuvant doxorubicin + cyclophosphamide in triple negative tumors from our neoadjuvant cohort. pCR pathological complete response. d Effect of CCND1 overexpression on doxorubicin sensitivity in T47D (CCND1 neutral) breast cancer cell lines. Blue: control, red and black: CCND1 overexpression. Mean ± SD values of two independent CCND1 overexpressing cell lines (O/E #1, O/E #2),with technical replicates are depicted (n = 3). e Effect of CCND1 knock-down on doxorubicin sensitivity in ZR-75-1 (CCND1 amplified) breast cancer cell lines. Blue: control, red: upon CCND1 knock-down. Mean ± SD values of independent biological replicates are shown (n = 2). For box plots in this figure, the boxes indicate the interquartile range, while lower and upper bars correspond to the minimum and maximum non-outlier values of the data distribution. Outliers are defined as values outside 1.5× the interquartile range from the box. The center line indicates the median value.

