. 2018 Jan 3;8(2):1098–1115. doi: 10.1039/c7ra12451a

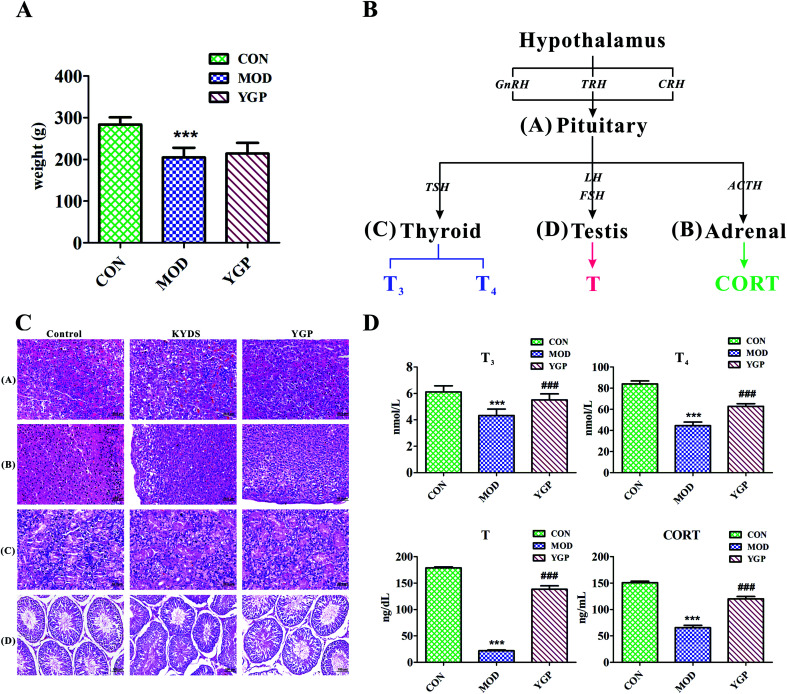
Fig. 2. (A) Changes in the body weight index of rats (control group, model group, and YGP-treated group) on day 23; (B) the occurring mechanisms of KYDS-HPT axis and HPA axis disorders; and (C) H&E staining of pituitary, adrenal, thyroid and testicular tissue sections [(A–C): magnification 40×; and (D): magnification 20×]. (D) The biochemical characteristics used for the evaluation of the therapeutic effects of YGP on KYDS. Bar plots represent the mean relative hormone intensities and standard deviations, error bars represent the mean ± SD (Student's t-test: * significant difference from control group at p < 0.05; ** significant difference from control group at p < 0.01; *** significant difference from control group at p < 0.001; # significant difference from model group at p < 0.05; ## significant difference from model group at p < 0.01; ### significant difference from model group at p < 0.001. After treatment with YGP, various levels of T3, T4, T and CORT in the treatment group returned to the level of the control group) (one-way ANOVA with a Bonferroni correction).

Fig. 2