. 2018 Jan 3;8(2):1098–1115. doi: 10.1039/c7ra12451a

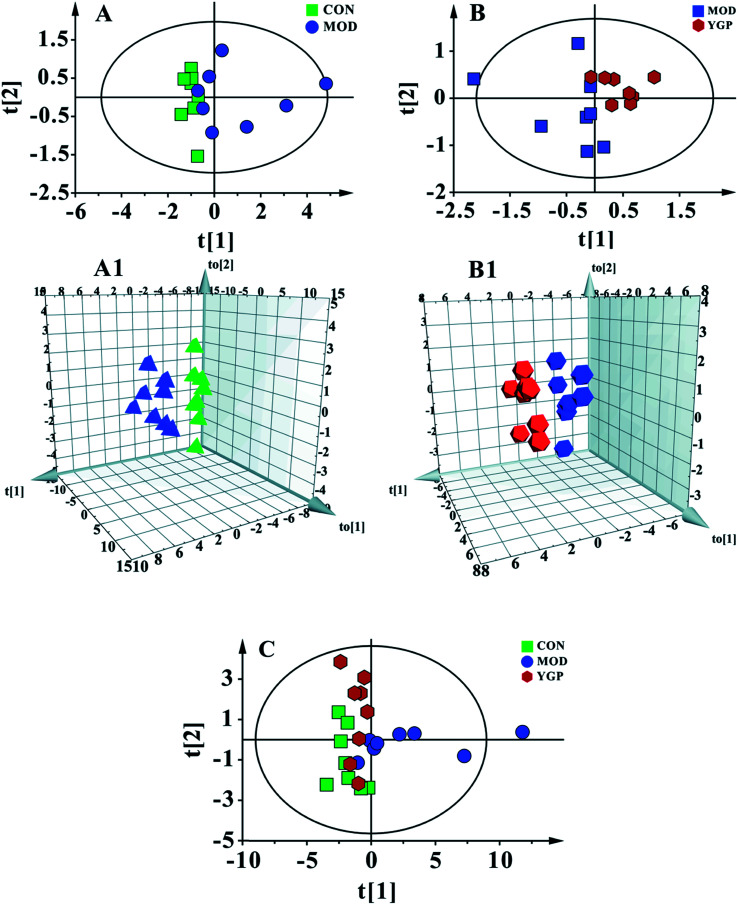
Fig. 5. Multivariate analyses of serum 1H NMR spectra data at the end of the 23rd day. (A) PCA score plot of the control (green) and KYDS model groups (blue) (R2X = 0.97, Q2 = 0.846) a; and (A1) a 3D plot of OPLS-DA, based on serum metabolites discriminating the control and KYDS model groups (R2X = 0.772, R2Y = 0.987, Q2 = 0.65). (B) PCA score plot of the KYDS model group (blue) and YGP group (red) (R2X = 0.975, Q2 = 0.584); and (B1) a 3D plot of OPLS-DA based on serum metabolites discriminating the KYDS model group and YGP group (R2X = 0.787, R2Y = 0.995, Q2 = 0.809). (C) PCA score plot of serum results from the three groups (R2X = 0.793, Q2 = 0.606).

Fig. 5