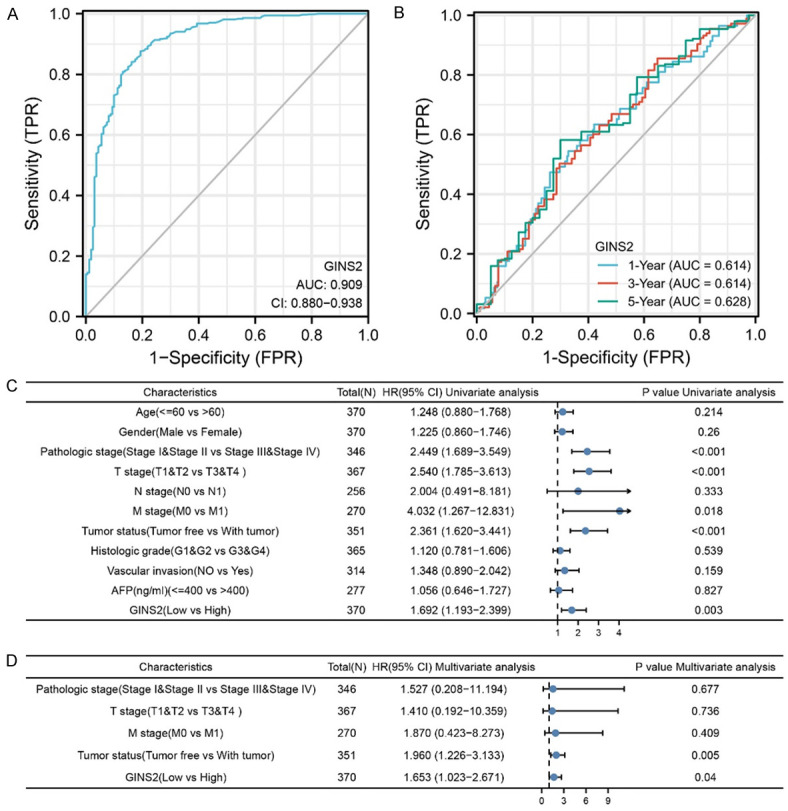
Figure 3.

GINS2 expression and other clinicopathologic factors with OS in LIHC were calculated via univariate and multivariate regression analysis. A. The ROC curve of diagnosis to distinguish tumor from normal tissue. The AUC was 0.909. B. Time-dependent survival ROC curve analysis to predict 1-, 3-, and 5-year survival rates. C. The forest plot of univariate regression analysis. Among the factors, T stage, Pathologic stage, Tumor status, and GINS2 expression were identified as statistically significantly associated with the likelihood for OS univariate analysis. D. The forest plot of multivariate regression analysis.
