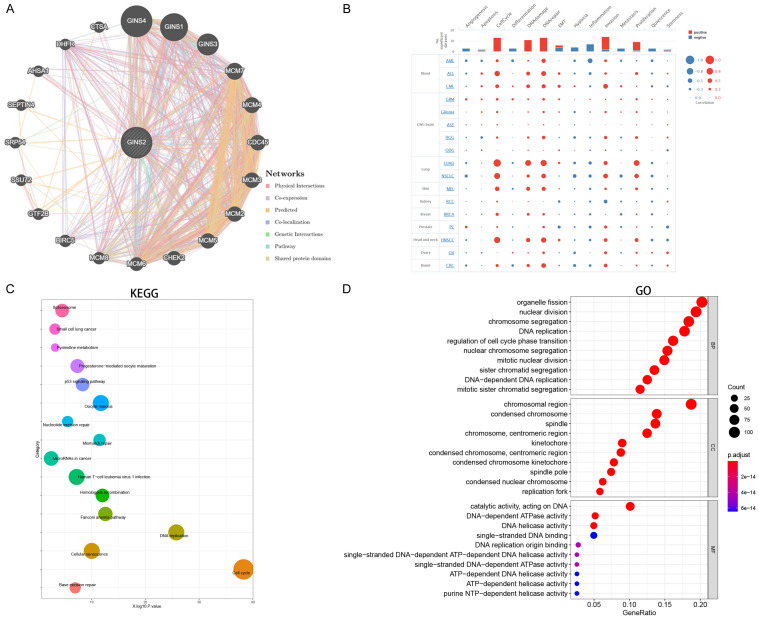
Figure 5.
PPI, GO and KEGG analysis of the genes co-expressed with GINS2 in HCC. A. The protein-protein interaction network of GINS2 was constructed using GeneMANIA. B. Single-cell analysis displayed the correlation between GINS2 and 14 functional states (including angiogenesis, apoptosis, cell cycle, differentiation, DNA damage, DNA repair, EMT, hypoxia, inflammation, invasion, metastasis, proliferation, stemness, and quiescence) in different tumor types. C, D. Significantly enriched KEGG pathways and GO annotations of the genes co-expressed with GINS2 in HCC based on the LinkedOmics database.

