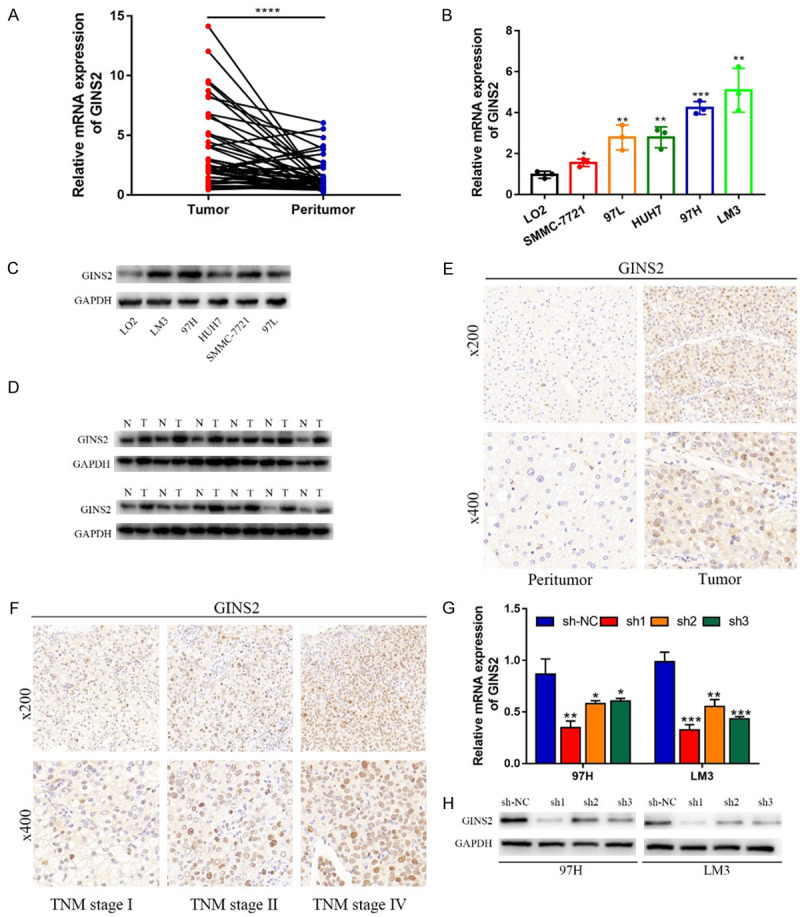
Figure 6.

GINS2 expression decreased in HCC tissue samples and cell lines. A. qRT-PCR was used to examine the expression of GINS2 in 45 pairs of HCC tissues and corresponding peritumor tissues. B. The mRNA expression levels of GINS2 in HCC cell lines and normal LO2 cells. C, D. Western blot showing that GINS2 was upregulated in HCC tissues and HCC cell lines compared with adjacent healthy tissues and LO2 cells. E, F. The protein level of GINS2 in HCC specimens and adjacent normal tissues was detected by IHC. G, H. GINS2 knockdown efficiency was analyzed by qRT-PCR and western blot. All data are represented as mean ± S.E.M. *P < 0.05; **P < 0.01; ***P < 0.001.
