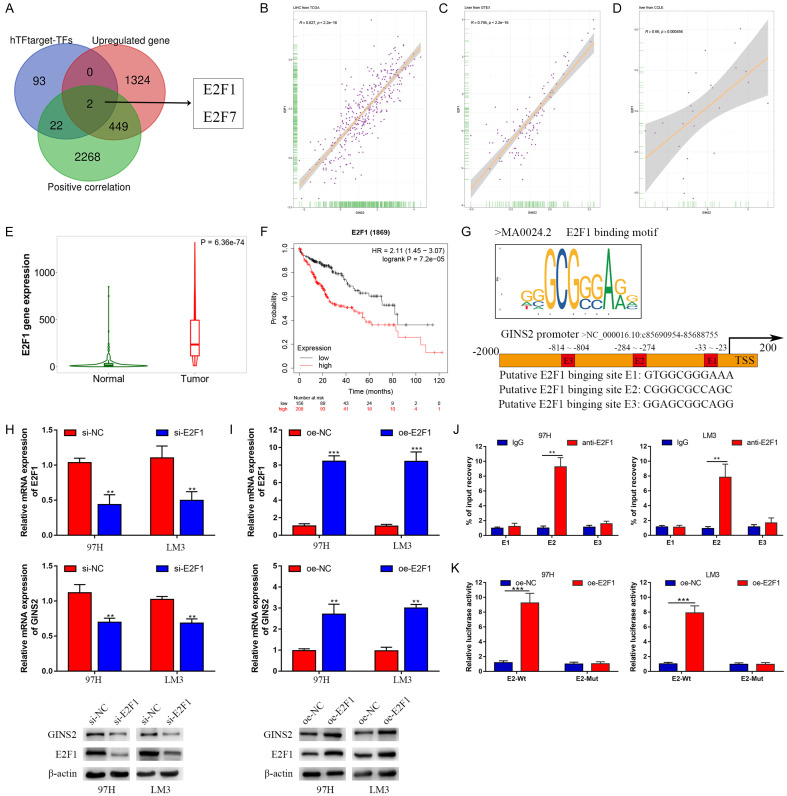
Figure 10.
GINS2 was transcriptionally activated by E2F1. A. Venn diagrams of three gene lists: transcription factors predicted by the hTFtarget database, upregulated genes in LIHC according to the data from TCGA database, genes positively correlated with GINS2 expression in HCC according to the LinkedOmics database. B-D. Correlation between E2F1 and GINS2 in the TCGA, GTEx, and CCLE databases. E. Violin plot of E2F1 expression between HCC tissues and adjacent healthy tissues according to data from the TCGA database. F. Kaplan-Meier survival curve analysis of the prognostic significance of E2F1 expression based on the Kaplan-Meier database. G. E2F1-binding motifs and predicted E2F1-binding sites (E1, E2, and E3) on the promoter region of GINS2 were obtained from the JASPAR database. H, I. Expression of E2F1 and GINS2 was confirmed by qRT-PCR or western blot in 97H and LM3 cells transfected with si-E2F1, si-NC, pcDNA3.1, or pcDNA3.1-E2F1. J. qRT-PCR analysis of ChIP products validated the binding capacity of E2F1 to the GINS2 promoter. K. The luciferase reporter assay further confirmed direct binding of E2F1 to the GINS2 promoter in 97H and LM3 cells transfected with pcDNA3.1 or pcDNA3.1-E2F1. All data are presented as mean ± S.E.M. *P < 0.05; **P < 0.01; ***P < 0.001.

