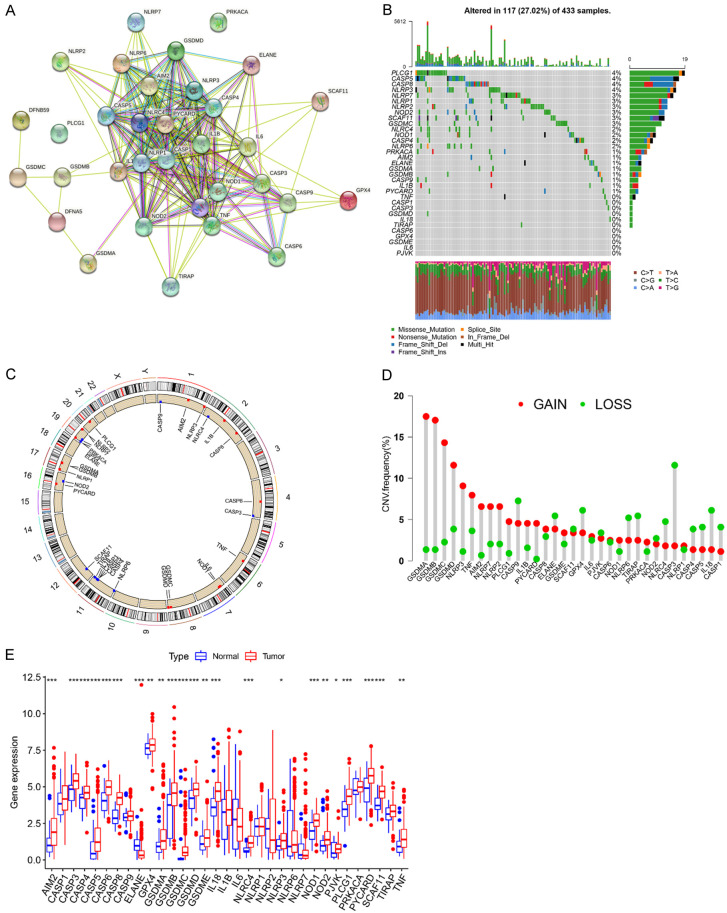
Figure 1.
The landscape of genetic and expression variation of PRGs in GC. A. PPI network of 33 PRGs. B. Genetic alterations of 33 PRGs with a frequency of 27.02% in 117 of 433 GC patients from TCGA-STAD cohort. Each column represents an individual patient. C. The location of CNV alteration of 33 PRGs on chromosomes using the data from TCGA-STAD cohort. D. The CNV mutation frequency of 33 PRGs in TCGA-STAD cohort. The column height represents the alteration frequency. The deletion frequency, green dot; The amplification frequency, red dot. E. The expression levels of 33 PRGs between the normal tissues and GC tissues. Normal tissues, blue; Tumor tissues, red. The asterisks represent the statistical p-value (*P<0.05; **P<0.01; ***P<0.001).

