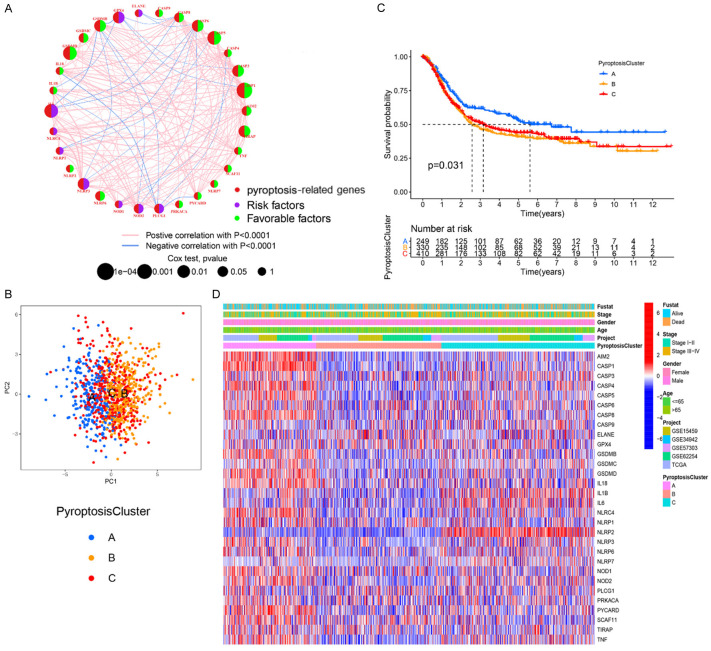
Figure 2.
Characteristics of pyroptosis-related molecular patterns. A. The interaction network of PRGs in GC. The size of circle represents the effects of PRGs on the clinical outcome of GC patients (P<0.0001, P<0.001, P<0.01, P<0.05 and P<1, Cox test). Green dots in the circle, favorable factors of prognosis. Purple dots in the circle, unfavorable factors of prognosis; B. PCA of the mRNA expression profiles of PRGs confirms the three pyroptosis clusters (blue, pyroptosis Cluster A; yellow, pyroptosis Cluster B; red, pyroptosis Cluster C). C. Survival analyses for the three pyroptosis-related molecular patterns based on 989 GC patients from five cohorts (GSE15459, GSE34942, GSE57303, GSE62254, and TCGA-STAD) including 249 patients in pyroptosis Cluster A, 330 patients in pyroptosis Cluster B, and 410 patients in pyroptosis Cluster C (Log-rank test, P=0.031). D. Heatmap presents the correlation between the three pyroptosis clusters and clinicopathological characteristics of GC patients.

