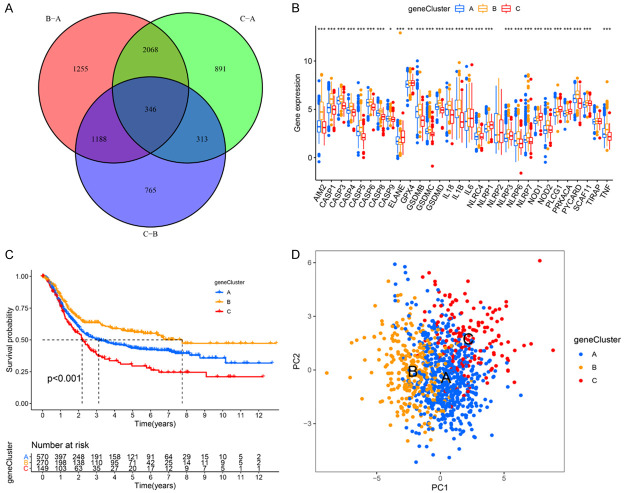
Figure 3.
Characteristics of pyroptosis gene clusters. A. Venn diagram presents 346 DEGs among the three pyroptosis clusters. B. The expression levels of PRGs among the three pyroptosis gene clusters. *P<0.05; **P<0.01; ***P<0.001. C. Survival analyses for the pyroptosis gene clusters based on 989 GC patients including 570 patients in pyroptosis gene Cluster A, 270 patients in pyroptosis gene Cluster B, and 149 patients in pyroptosis gene Cluster C (Log-rank test, P<0.01). D. PCA of the mRNA expression profiles of PRGs confirms the pyroptosis gene clusters (blue, gene Cluster A; yellow, gene Cluster B; red, gene Cluster C).

