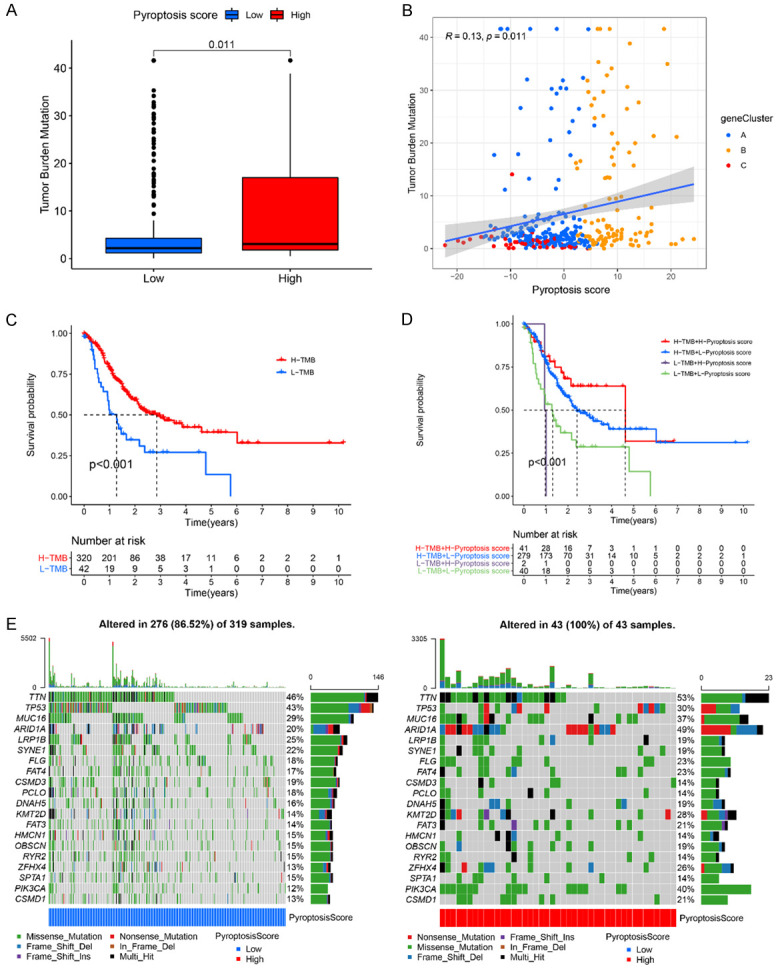
Figure 6.

The correlation between the pyroptosis score and somatic variants. A. Difference of TMB level in the high and low pyroptosis score groups. Wilcoxon test, P=0.011. B. Scatterplots presents the positive correlation between pyroptosis score and mutation load in the TCGA-STAD cohort. Spearman correlation analysis, R=0.13, P=0.011. C. Kaplan-Meier curves for GC patients with high and low TMB in the TCGA-STAD cohort. Log rank test, P<0.001. D. Kaplan-Meier curves for GC patients with different TMB status and pyroptosis scores in the TCGA-STAD cohort. Log rank test, P<0.001. E. Mutational landscape of significantly mutated genes in TCGA-STAD cohort stratified by low (left panel, bule) and high pyroptosis score (right panel, red) subgroups. Each column represents an individual GC patient.
