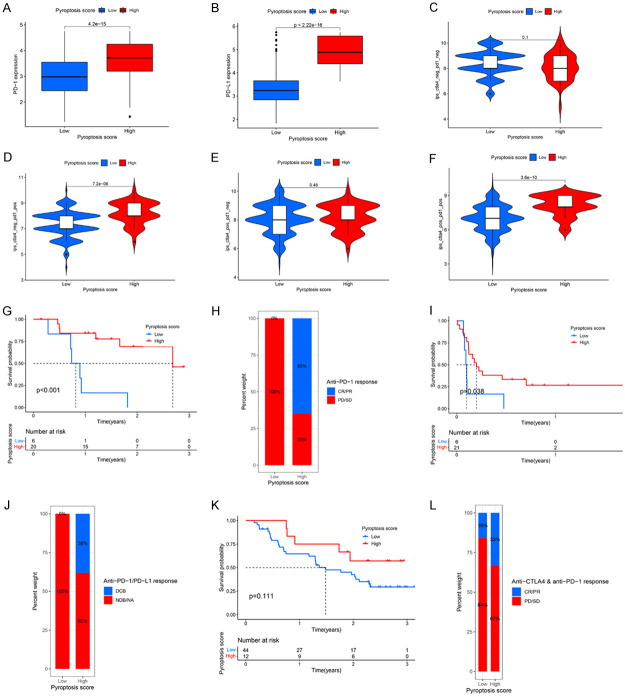
Figure 8.
Prediction values of pyroptosis score in immunotherapeutic benefits. (A, B) Difference in PD-1 (A) and PD-L1 (B) expression between high and low pyroptosis score groups (P<0.0001). (C-F) Comparison of IPS between the GC patients with high and low pyroptosis score groups in the CTLA4 negative/positive or PD-1 negative/positive groups. CTLA4_positive or PD1_positive represents anti-CTLA4 or anti-PD-1/PD-L1 therapy, respectively. (G, H) Kaplan-Meier curves (G) and clinical response (H) to anti-PD-1 therapy for patients in high and low pyroptosis score groups from the GSE78220 cohort. (I, J) Kaplan-Meier curves (G) and clinical response (H) to anti-PD-1/PD-L1 therapy for patients in high and low pyroptosis score groups from the GSE135222 cohort. (K, L) Kaplan-Meier curves (K) and clinical response (L) to anti-CTLA4 and anti-PD-1 therapy for patients in high and low pyroptosis score groups from the GSE91061 cohort. CR, Complete Response; PR, Partial Response; SD, Stable Disease; PD, Progressive Disease; DCB, Durable Clinical Benefit; NDB, Non-Durable Benefit; NA, Not Determined.

