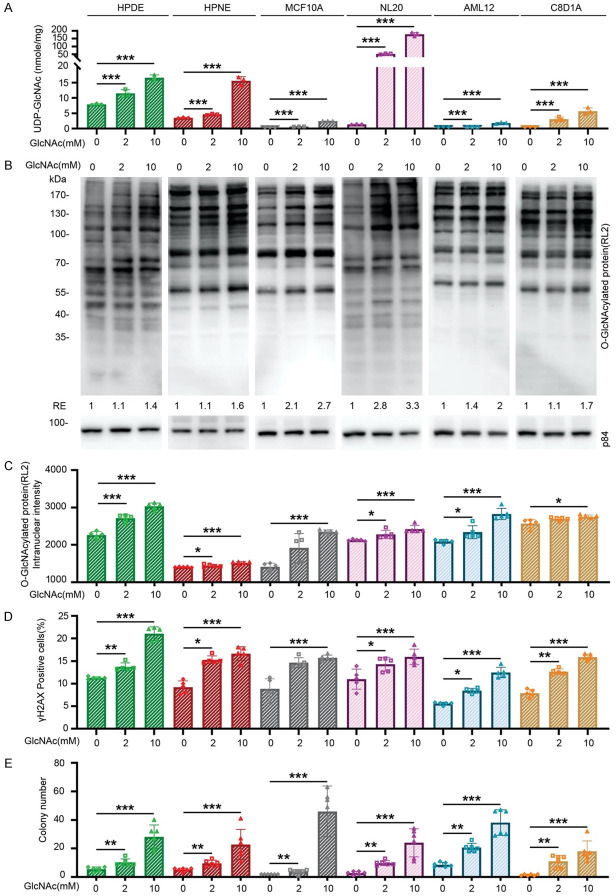
Figure 7.
GlcNAc treatment increases cellular UDP-GlcNAc levels, protein O-GlcNAcylation, DNA damage, and anchorage-independent growth in various non-tumorigenic cell lines. Non-tumorigenic cell lines, including human pancreatic cells (HPDE and HPNE), human mammary epithelial cells (MCF10A), human lung epithelial cells (NL20), mouse hepatocyte cells (AML12), and mouse astrocyte cells (C8D1A), were used in this study. GlcNAc (2 mM and 10 mM) was added to the culture medium and changed daily. A. The cellular levels of UDP-GlcNAc in various cell lines after treatment in the indicated concentration of GlcNAc for 3 days. The cellular levels of UDP-GlcNAc were determined by targeted LC/MS (n=3). B. Protein O-GlcNAcylation levels in various cell lines treated with the indicated concentration of GlcNAc for 3 days. Cells were analyzed by immunoblotting analysis with an anti-RL2 antibody. Data are normalized to those from vehicle treatment and the amount of internal control protein, p84. C. Quantitative results of the intranuclear intensity of protein O-GlcNAcylation. Various cell lines were treated with the indicated concentration of GlcNAc for 3 days and were subjected to immunofluorescent staining with an anti-RL2 antibody. 2,000 cells were counted in each experiment, and each assay was performed individually 5 times. D. Quantitative results of γH2AX positive cell percentage by immunofluorescent staining in various cell lines treated with the indicated concentration of GlcNAc for 3 days. 2,000 cells were counted in each experiment, and each assay was performed individually 5 times. E. Colony number of soft agar assay among HPDE, HPNE, MCF10A, NL20, AML12, and C8D1A after indicated concentration of GlcNAc treatment for 14 days. Each well contains 500 cells per well, n=5. Values show mean ± SEM. *P<0.05; **P<0.01; ***P<0.001 (two-tailed Student’s t-test).

