
FIGURE 2.
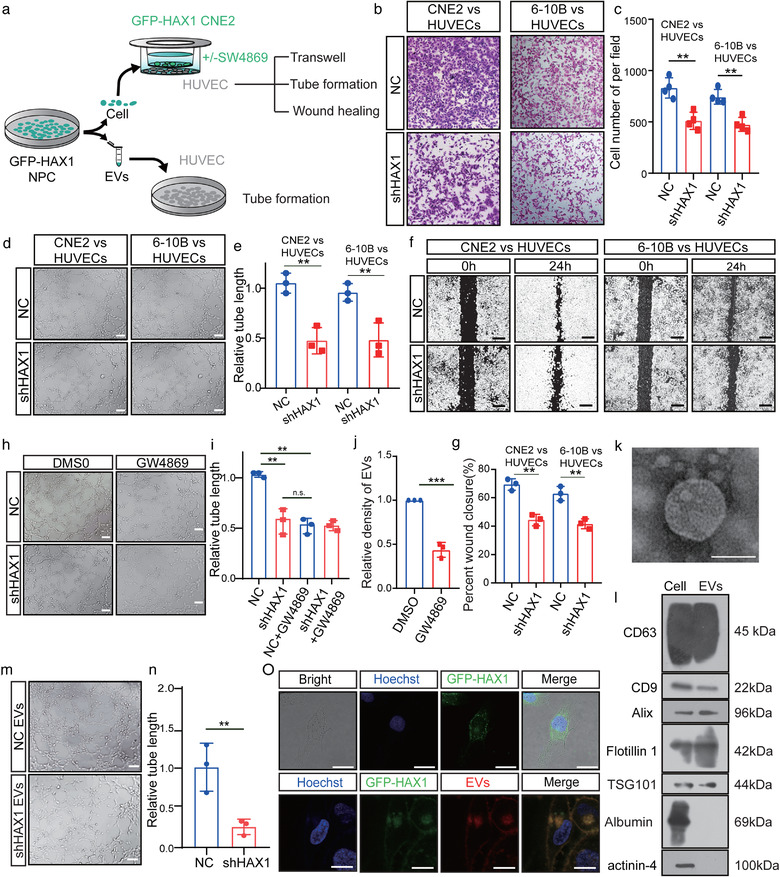
HAX1‐rich EVs promote angiogenesis in vitro. (a) Schematic diagram of HUVECs processing. (b–g) Co‐culture of HUVECs with NPC‐NC or NPC‐shHAX1 (b) The migration potential of HUVECs was measured using the Transwell assay, bar: 100 µm. (c) Statistical comparison of the cell number. (**p < 0.01, Student's t‐test). (d, e) Tube formation assays were performed to measure the tube forming ability of HUVECs, bar: 100 µm. (**p < 0.01, Student's t‐test). (f, g) The migration potential of HUVECs was measured using the wound closure assay, bar 200 µm. (**p < 0.01, Student's t‐test). (h, i) After 4 h of treatment with DMSO or GW4869, the tube forming ability of HUVECs co‐cultured with two groups of CNE2 was measured. (n.s. p > 0.05 and **p < 0.01, Student's t‐test). (j) CNE2 cells treated with DMSO or GW4869 for 4 h, and measured the density of EVs in CNE2 cells supernatants (k) Representative transmission electron micrograph of EVs derived from CNE2 cells, bar 100 nm. (l) Western blotting analysis for CD63, CD9, Alix, Flotillin 1, TSG101, Albumin and actinin‐4 in CNE2 cells and CNE2 cells EVs. (m, n) Tube formation assays were performed to measure the tube forming ability of HUVECs treated with two groups of EVs, bar: 100 µm. (**p < 0.01, Student's t‐test). (o) Top, HUVECs were cocultured with CNE2 cells transfected with fluorescent GFP‐HAX1 lentivirus in a chamber. Down, uptake of EVs released by CNE2 cells in HUVECs. Images were obtained by confocal microscopy, blue: Hoechst staining; red: PKH26‐labelled EVs; green: GFP‐HAX1, bar: 25 µm