
FIGURE 6.
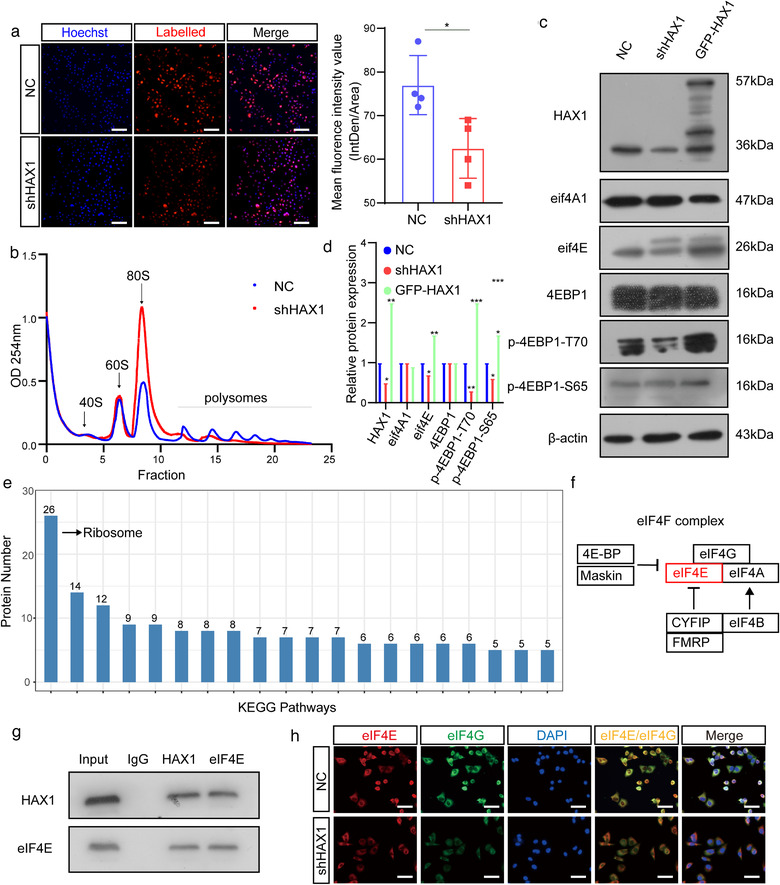
HAX1 promotes protein translation in HUVECs. (a) Analyses of nascent protein synthesis labeled with L‐Homopropargyl glycine incorporation, detected in HUVECs‐NC and HUVECs‐shHAX1 by fluorescence microscopy. Quantify nascent protein expression by the quantification of fluorescence intensity. Blue: nuclei; Red: nascent protein, bar: 100 µm. (*p < 0.05, Student's t‐test). (b) Polysome profiling of HUVECs‐NC and HUVECs‐shHAX1. Absorbance at 254 nm. (c, d) Western blot analysis of the protein levels in HUVECs‐NC and HUVECs‐shHAX1 (*p < 0.05, **p < 0.01, p < 0.001, Student's t‐test). (e) KEGG pathway enrichment analysis of the mass spectrometry results. (f) Schematic diagram of HAX1 affecting eIF4F. (g) Co‐immunoprecipitation analysis between HAX1 and eIF4E in HUVECs. (h) Immunofluorescence of eIF4G and eIF4E in HUVECs, bar: 50 µm