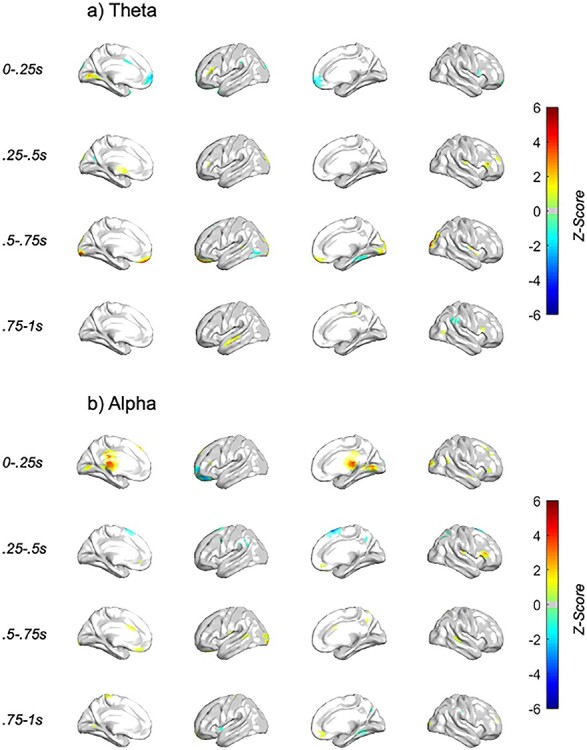
Figure 5 .

Neural features associated with behavior specific to the dlPFC stimulation condition. Z-score of behavior LME analyses with dlPFC TMS single pulse (a) theta (4–7.5 Hz) and (b) alpha (8–12 Hz) spectral response, with TMS subthreshold pulse occurring at t = 0 s. The voxels visualized are masked by those included in full stimulation condition × behavior analyses. Only those voxels with P < 0.05 are plotted.
