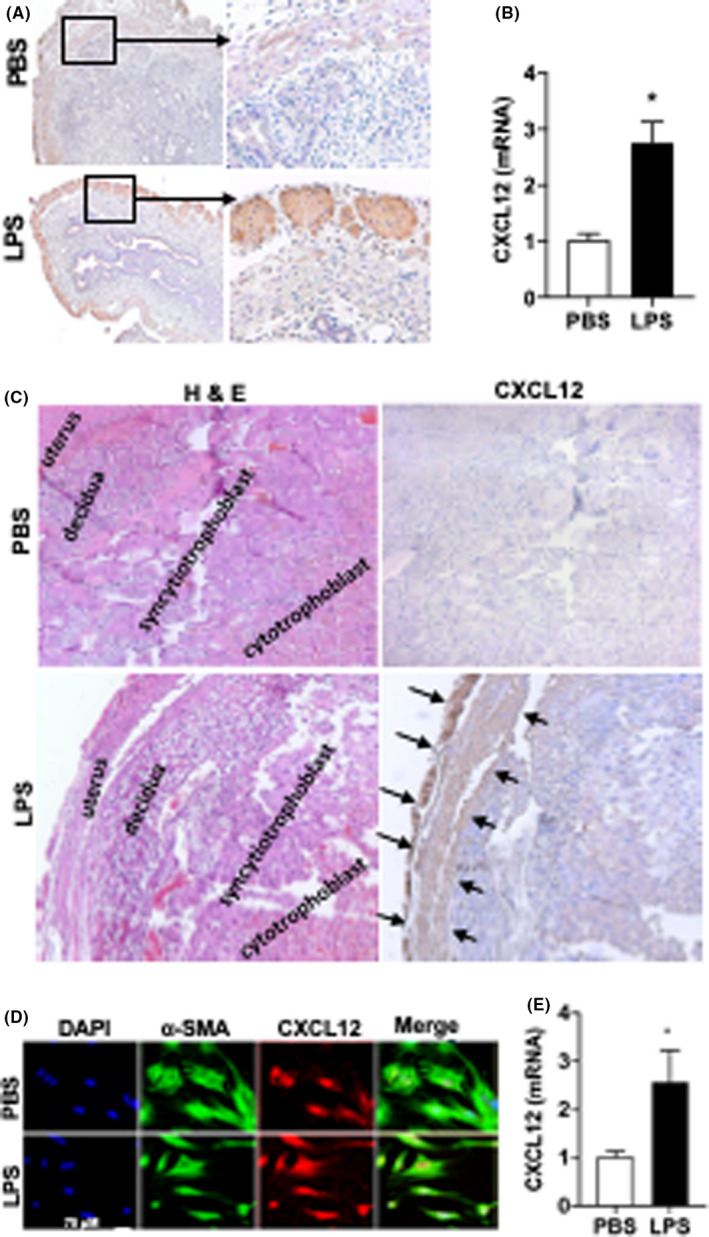
FIGURE 2.

LPS upregulated CXCL12 expression in uterus. (A) Representative IHC images of CXCL12 expression. Arrow (black) shows the CXCL12 expression in myometrium. Original magnification, 100× and 400×. (B) CXCL12 mRNA levels were significantly increased in uterine tissue obtained from mice treated by LPS. Each bar represents the mean ± SEM for data from three individual experiments and each experiment was performed in duplicate. *p < 0.05 versus PBS. (C) Left: haematoxylin and eosin staining showing structural morphology of uterus, decidua, syncytiotrophoblast and cytotrophoblast treated by PBS and LPS. Right: IHC staining for CXCL12 showing representative images of uterus, decidua, syncytiotrophoblast and cytotrophoblast treated with either PBS or LPS. Original magnification (A) 100× and (B) 400×. (D, E) CXCL12 Expression in macrophages. (D) Fluorescence confocal microscopy analyses of CXCL12 expression in macrophages. Representative images of IF showing DAPI, α‐SMA, CXCL12 expression and merged images for macrophages treated with PBS and LPS. CXCL12 expression is high in LPS‐treated cells. Nuclei were stained by DAPI and are shown in blue. Scale bar: 75 µM. (E) CXCL12 mRNA levels were significantly increased in macrophages treated by LPS compared with PBS. Each bar represents the mean ± SEM for data from three individual experiments and each experiment was performed in duplicate. *p < 0.05 versus PBS. α‐SMA, alpha smooth muscle actin; DAPI, 4,6‐diamidino‐2‐phenylindole; ELISA, enzyme‐linked immunosorbent assay; IF, immunofluorescence; IHC, immunohistochemistry; LPS, lipopolysaccharide; PBS, phosphate buffered saline; SEM, standard error of mean
