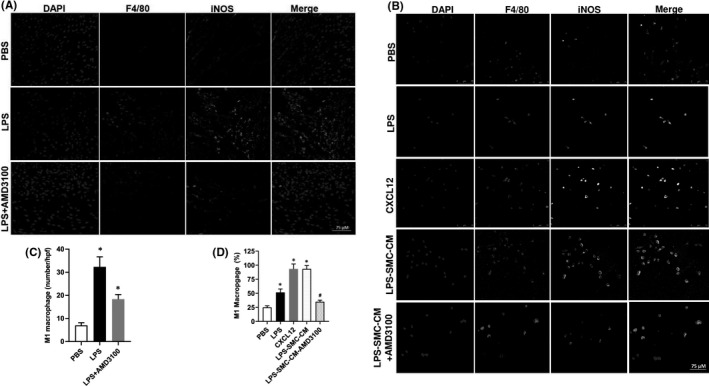
FIGURE 5.

In vivo: AMD3100 inhibited LPS‐stimulated M1 macrophage polarization. (A, B) Fluorescence confocal microscopy analysis of M1 macrophage polarization. Representative images of IF showing DAPI, F4/80+ve, iNOS+ve and merged images. Nuclei were stained by DAPI and are shown in blue. F4/80 marks macrophages while iNOS is a marker of M1 macrophages. (A) Uterus tissue from mice treated with PBS, LPS or LPS + AMD3100 respectively. (B) Macrophages treated with PBS, LPS, CXCL12, LPS‐SMC‐CM and LPS‐SMC‐CM + AMD3100 respectively. (C) Quantitative analyses of macrophage polarization (iNOS+ve cells) in uterus showing significant increase in polarization in LPS‐treated macrophages compared to PBS. Treatment with AMD3100 inhibited the polarization stimulated by LPS. (D) Quantitative analyses of macrophage polarization (iNOS+ve cells) in vitro showing significant increase in polarization in LPS, CXCL12 and LPS‐SMC‐CM treated macrophages compared with PBS treatment. AMD3100 inhibited the polarization stimulated by LPS. Results shown as mean ± SE. *p < 0.05 versus PBS while # p < 0.05 versus LPS‐SMC‐CM. Scale bar: 75 μm. DAPI, 4,6‐diamidino‐2‐phenylindole; IF, immunofluorescence; IHC, immunohistochemistry; LPS, lipopolysaccharide; PBS, phosphate buffered saline; SE, standard error; SMC‐CM, smooth muscle cell conditioned media
