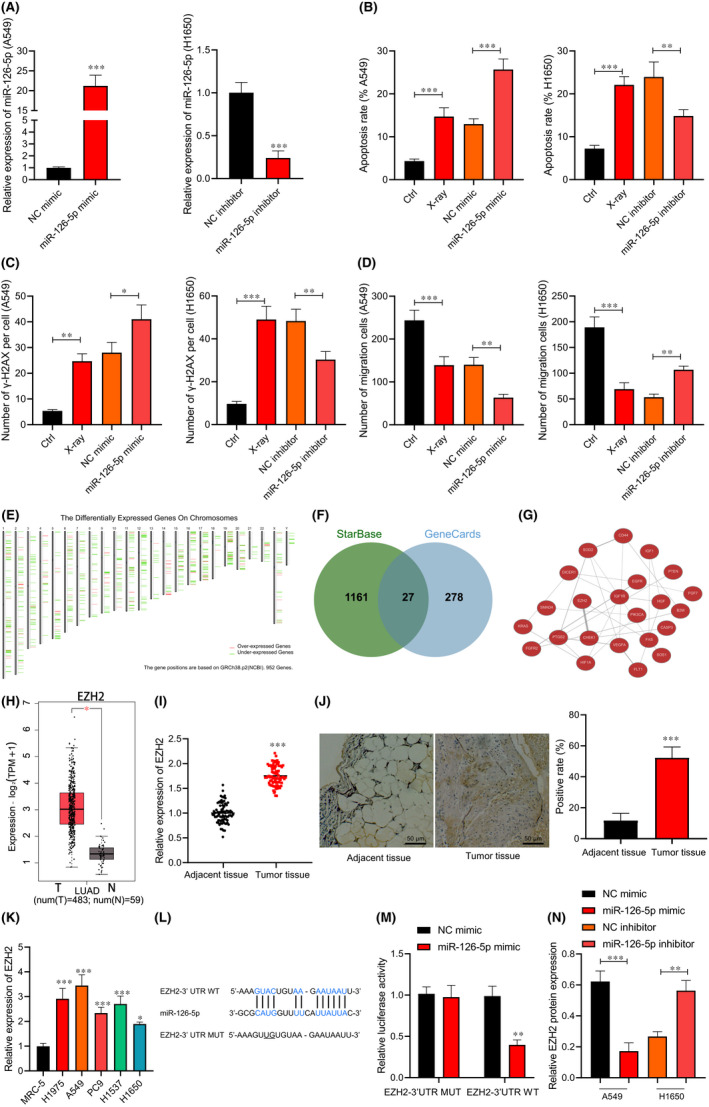
FIGURE 2.

miR‐126‐5p expression affects the radiosensitivity of lung adenocarcinoma cells. A549 and H1650 cells were treated with 10 Gy of X‐ray and transduced with miR‐126‐5p mimic or inhibitor. (A) The overexpression and silencing efficiency of miR‐126‐5p detected by RT‐qPCR. (B) A549 and H1650 cell apoptosis detected by flow cytometry. (C) The number of γ‐H2AX focus in A549 and H1650 cells detected by immunofluorescence staining. (D) A549 and H1650 cell migration detected by Transwell assay. (E) The positions of significantly DEGs in lung adenocarcinoma on chromosomes obtained using GEPIA2 tool. (F) The Venn map of the intersection of prediction results in the StarBase and GeneCards. (G) The co‐expression relationship network diagram of the candidate target genes using the Coexpedia website. (H) Box plot of high expression of EZH2 in lung adenocarcinoma using the GEPIA2 tool. (I) EZH2 expression in lung adenocarcinoma tissues and adjacent normal tissues determined by RT‐qPCR (n = 78). (J) EZH2 expression in lung adenocarcinoma tissues and adjacent normal tissues verified by immunohistochemical staining (n = 78, Scale bar = 25 μm). (K) EZH2 expression in five lung adenocarcinoma cell lines and human embryonic lung fibroblast cell lines determined by RT‐qPCR. (L) The binding site of miR‐126‐5p and target gene EZH2 predicted by StarBase website. (M) The targeted binding of miR‐126‐5p to EZH2 verified using the dual‐luciferase reporter gene assay. The A549 and H1650 cells were transduced with miR‐126‐5p mimic or miR‐126‐5p inhibitor. (N) EZH2 protein level in A549 and H1650 cells measured by Western blot analysis. Data are shown as the mean ± standard deviation of three technical replicates. Data comparisons between two groups were analysed by unpaired t‐test. Data comparisons among multiple groups were analysed by the one‐way ANOVA with Tukey's post hoc test. *p < 0.05; **p < 0.01; ***p < 0.001
