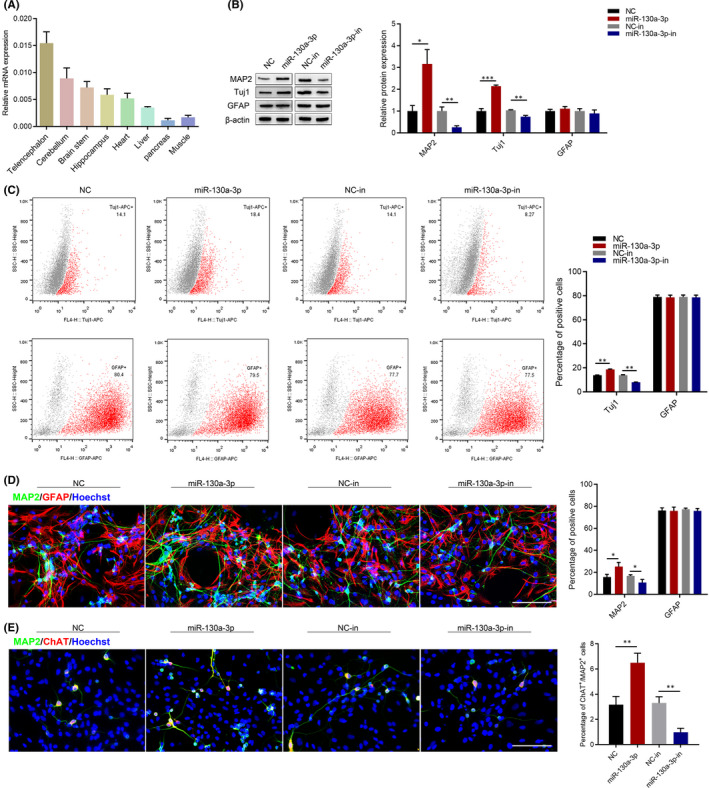
FIGURE 2.

Effects of miR‐130a‐3p on NSC differentiation. (A) miR‐130a‐3p expression in different tissues of adult SD rat was analysed performing qRT‐PCR using Gapdh as endogenous control. The results are described as the mean ± SEM at least three separate experiments. NSCs were transfected with miR‐130a‐3p/NC mimics and miR‐130a‐3p/NC inhibitor for 7d. (B) Western blot was performed to detect the expression of the differentiation markers, MAP2, Tuj1 and GFAP. (C) The percentage of Tuj1 and GFAP positive cells were detected by flow cytometry assay. (D) Immunofluorescence analysis of MAP2(green) and GFAP (red) positive cells. Scale bars: 100 μm. (E) Immunofluorescence analysis of MAP2(green) and ChAT (red) positive cells. Scale bars: 100 μm. The results are described as the mean ± SEM at least three separate experiments. *p < 0.05, **p < 0.01 vs. indicated group. (two‐tailed paired Student's t‐test)
