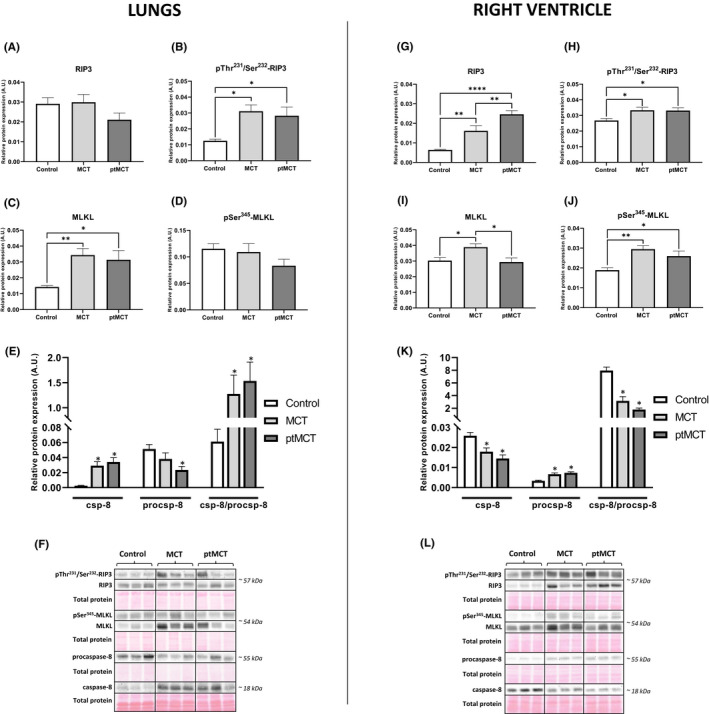
FIGURE 2.

Analysis of necroptotic signalling in the lung (left panel) and RV (right panel) tissue. Relative protein expression (A–E, G–K) and representative immunoblots and total protein staining (F, L) of RIP3 (A, G), pThr231/Ser232‐RIP3 (B, H), MLKL (C, I), pSer345‐MLKL (D, J), csp‐8 and procsp‐8 (E, K) in control group, monocrotaline group (MCT) and prematurely terminated monocrotaline group (ptMCT). Data are presented as mean ± SEM; n = 9–10 per group; * p ˂ 0.05
