
FIGURE 4.
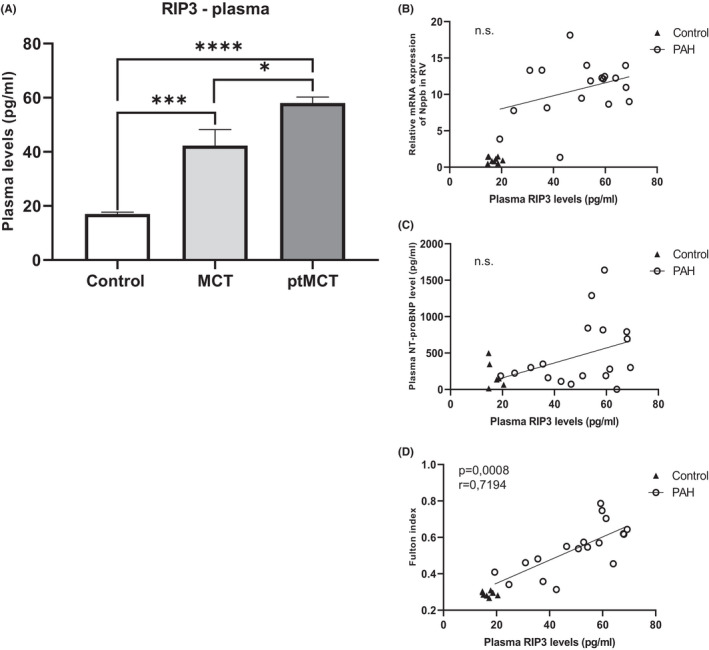
Analysis of the plasma levels of RIP3 and their correlation with markers of cardiac injury. The plasma levels of RIP3 (A) in control group, monocrotaline group (MCT) and prematurely terminated monocrotaline group (ptMCT). Correlation between the plasma RIP3 and Nppb in the RV (B), the plasma NT‐proBNP (C), Fulton index (D) in monocrotaline group (MCT) and prematurely terminated monocrotaline group (ptMCT). Data are presented as mean ± SEM; n = 9 per group; *p ˂ 0.05; n.s.—non‐significant