. 2018 Jan 10;8(5):2485–2489. doi: 10.1039/c7ra11347a

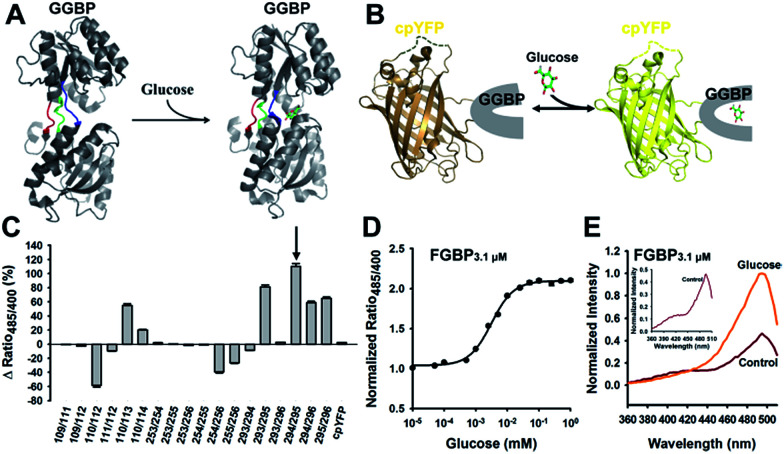
Fig. 1. Generation of cpYFP-based glucose sensors. (A) Crystallographic structures of glucose-free (PDB ID code 2FW0) and glucose-binding (PDB ID code 2FVY) GGBP from E. coli are drawn using the molecular-graphics software PyMOL based on Protein Data Bank files. The colored ribbon parts [residues 109–114 (blue), 253–256 (green), 293–296 (red)] represent the flexible and target region for the insertion of cpYFP to generate glucose indicators. (B) Design of glucose sensor, in which cpYFP was inserted into the flexible linker region of GGBP. Binding of glucose (green and red) changes protein conformation and fluorescence. (C) Comparison of cpYFP and 18 sensor variants in glucose responsiveness. (D) Titration of the chimeric Pro294/Tyr295 protein named as FGBP3.1 μM. Fluorescence ratios were normalized to the control condition in the absence of glucose. (E) Excitation spectra of FGBP3.1 μM with or without 100 mM glucose, normalized to the peak intensity in the glucose condition. Emission was measured at 528 nm. For C and D, data are presented in three biological replicates, and error bars represent SEM.

Fig. 1