. 2018 Jan 10;8(5):2485–2489. doi: 10.1039/c7ra11347a

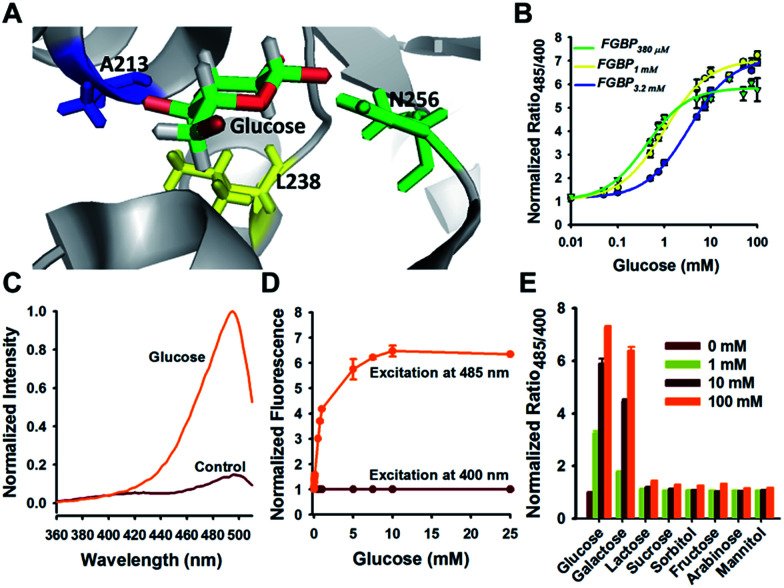
Fig. 3. Optimization tunes the affinity of glucose sensor. (A) Crystallographic structure of GGBP (PDB ID code 2FVY) showing the glucose-binding pocket. Three sites (A213, L238, and N256) are potential for sensor affinity improvement. (B) Titration curves of A213R (named FGBP3.2 mM), L238S (named FGBP1 mM), and N256S (named FGBP380 μM) mutants. (C) Excitation spectra of FGBP1 mM with or without 100 mM glucose, normalized to the peak intensity in the glucose condition. Emission was measured at 528 nm. (D) Fluorescence intensities of FGBP1 mM with excitation at 400 or 485 nm normalized to the initial value; emission at 528 nm. (E) Substrate specificity of FGBP1 mM as measured by ratio485/400 in the presence of various sugar ligands. Data were normalized to the control condition in the absence of ligand. For B, D, and E, data are presented in three biological replicates, and error bars represent SEM.

Fig. 3