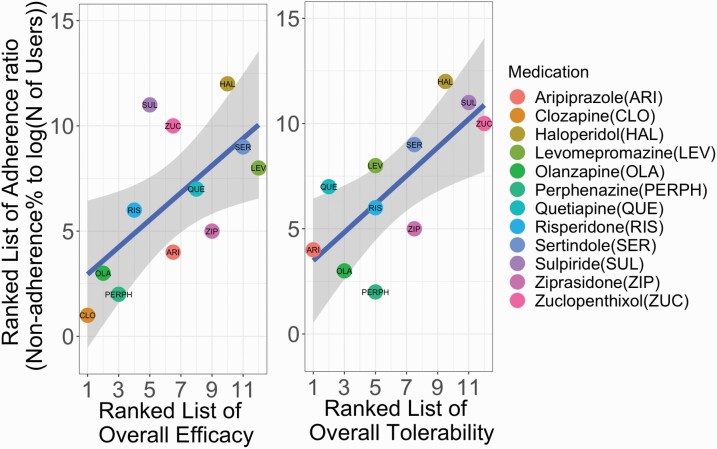
Fig. 1.
Relationships between the ratio between the percentage of nondispensed prescriptions and the number of users with overall efficacy (left) and overall tolerability (right). Efficacy and tolerability estimates were acquired from Huhn et al. 2019. Analysis of the relationship with tolerability with clozapine included is provided in supplementary figure 1. The blue regression lines are plotted with grey shaded 95% CIs.

