. 2018 Jan 12;8(5):2740–2750. doi: 10.1039/c7ra12042g

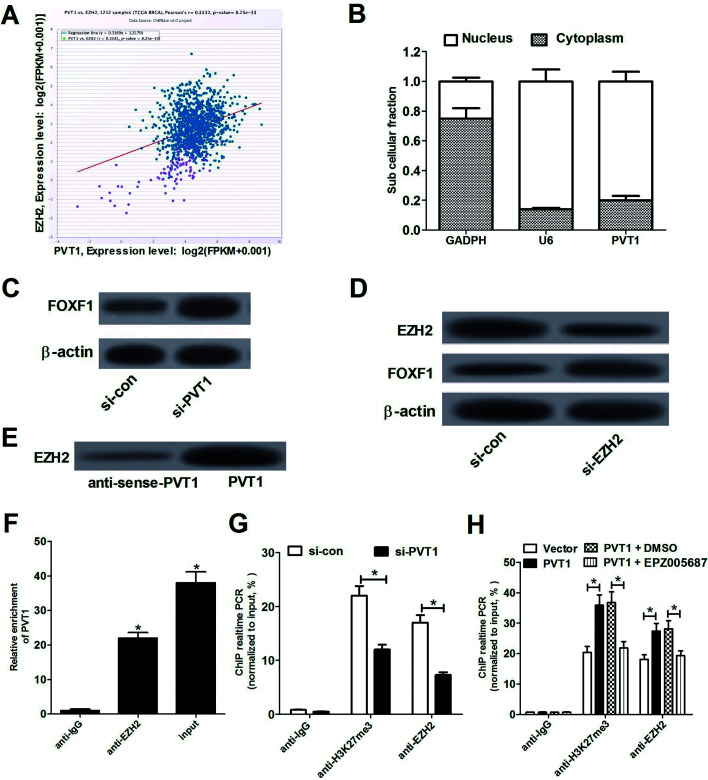
Fig. 3. PVT1 silenced FOXF1 expression by recruiting EZH2. (A) Pearson correlation coefficient analysis between EZH2 and PVT1 in 1212 clinical tissues samples of breast cancer. (B) The investigation of PVT1 subcellular location in MCF-7 cells. GAPDH acted as a cytoplasm control and U6 performed as a nucleus control. (C) FOXF1 protein expression in si-con- or si-FOXF1-transfected MCF-7 cells. (D) EZH2 and FOXF1 protein expression analysis in MCF-7 cells transfected with si-EZH2 or scramble control (si-con). RNA-protein pull down assays (E) and RIP assays (F) were performed to identify the direct binding between EZH2 and PVT1. (G) ChIP assays were performed using the antibody against IgG, H3K27me3 or EZH2 in MCF-7 cells transfected with si-con or si-PVT1. Then RT-qPCR assays were carried out to detect the enrichment patterns of H3K27me3 and EZH2 in FOXF1 promoter region. (H) MCF-7 cells were transfected with pcDNA3.1 vector or pcDNA-PVT1 and then were treated with or without DMSO or EPZ005687 (5 μM) for 48 h. Then, ChIP assays were performed using the antibody against IgG, H3K27me3 or EZH2, followed by the detection of the enrichment patterns of H3K27me3 and EZH2 in FOXF1 promoter region using RT-qPCR assays. *P < 0.05.

Fig. 3