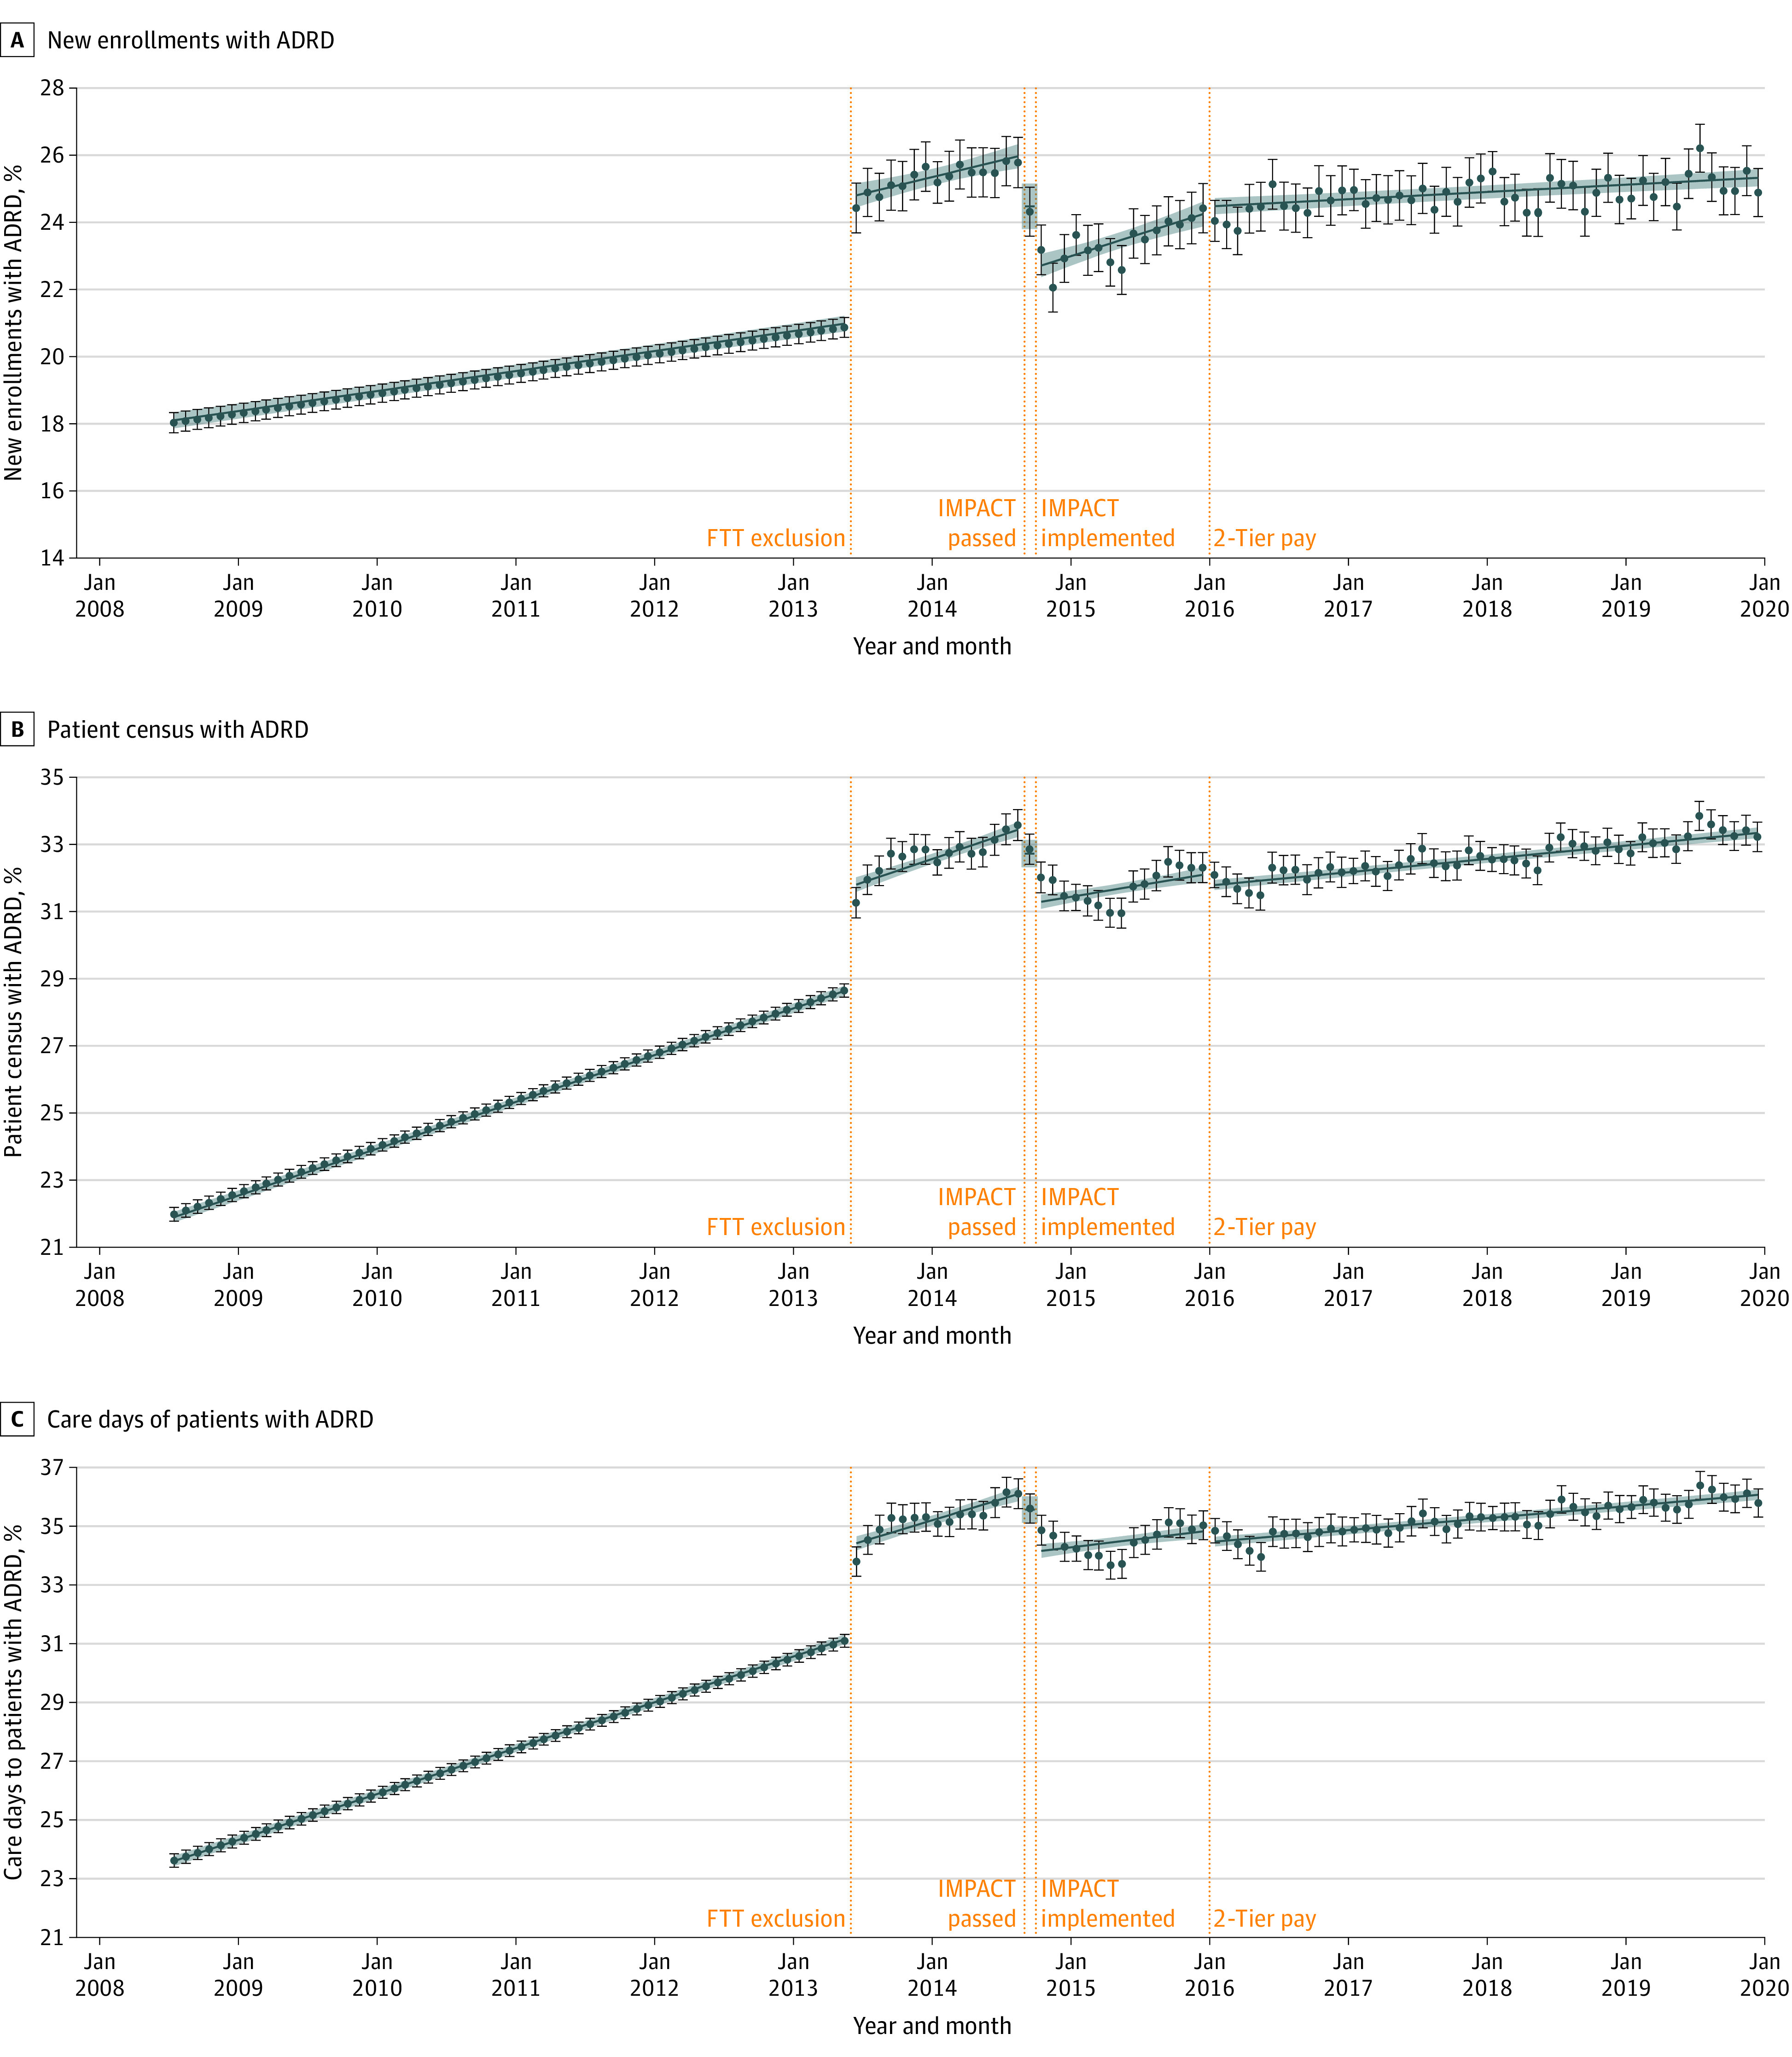
Figure 1. Estimated Trends in the Percentage of New Monthly Enrollees With Alzheimer Disease and Related Dementias (ADRD), Monthly Patient Census With ADRD, and Care Days Provided to Patients With ADRD From July 2008 to December 2019.

We ran minimally adjusted models (adjusted for month indicators and hospice fixed effects) treating postpolicy time splines as continuous variables (as shown in Table 2), as well as minimally adjusted descriptive models treating postpolicy time splines as series of binary indicators to estimate a separate coefficient for each month. Predicted trends shown (blue lines from linear models; colored circles from descriptive models) were computed by fitting model coefficients to hospice-month observations; to allow for clearer illustration of these trends over time, we excluded seasonality effects by ignoring the month fixed effects coefficients (ie, setting them to 0) when computing predicted trends. FTT indicates failure to thrive/debility; IMPACT, Improving Medicare Post-Acute Care Transformation Act; pay, payment.
