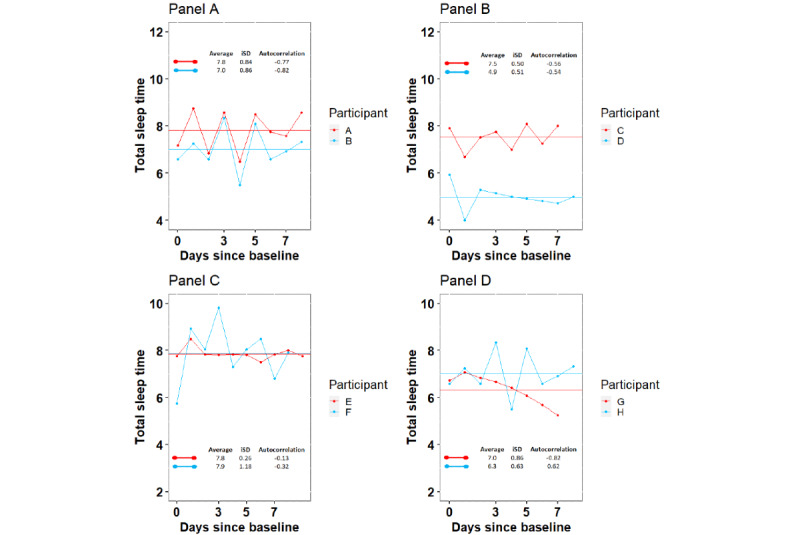
Figure 2.

Examples of individual participants’ actigraphy assessed daily total sleep time showing average, intraindividual SD (iSD), and autocorrelation scores over 10 days. In this figure, each panel plots the daily total sleep time for 2 selected participants over 10 days. The 10-day average sleep time is shown as a straight line. In all, 2 measures of variability of total sleep time across the 10-day period were calculated, the iSD and the autocorrelation. The individual panels show the following: (A) shows 2 participants with similar average iSD and autocorrelation scores, (B) shows 2 participants with different average but similar iSD and autocorrelation scores, and (C) shows 2 participants with similar average and autocorrelation scores. The higher iSD score of participant F reflects the higher amplitude of fluctuations in total sleep time when compared with the low amplitude of fluctuation in the total sleep time of participant E. (D) shows 2 participants with similar average scores. The autocorrelation score of participant H toward −1 reflects the fluctuation in total sleep time, whereas the autocorrelation score of participant G toward 1 reflects the day-to-day stability in total sleep time despite a decrease over the period of observation.
