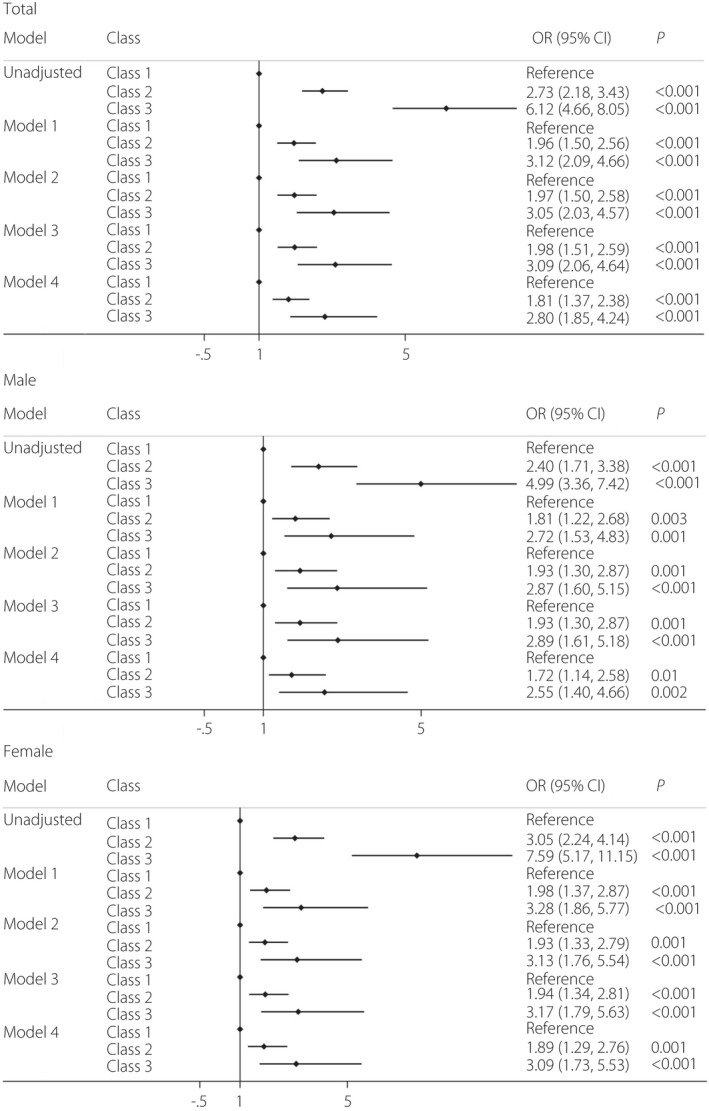
Figure 3.

Forest plot of the relationship between trajectory group and incidence of diabetes mellitus in total, and the male and female group. Model 1 was adjusted for age, sex, residence and body mass index (BMI) Model 2 was adjusted for age, sex, residence, BMI, education level, hypertension, smoking status and alcohol consumption. Model 3 was adjusted for age, sex, residence, BMI, education level, hypertension, smoking status, alcohol consumption, average energy intake, average carbohydrate intake, average fat intake and average protein intake. Model 4 was adjusted for age, sex, residence, BMI, education level, hypertension, smoking status, alcohol consumption, average energy intake, average carbohydrate intake, average fat intake, average protein intake, creatinine, high‐density lipoprotein cholesterol, low‐density lipoprotein cholesterol, triglyceride and total cholesterol.
