. 2018 Jan 24;8(9):4494–4502. doi: 10.1039/c7ra09090k

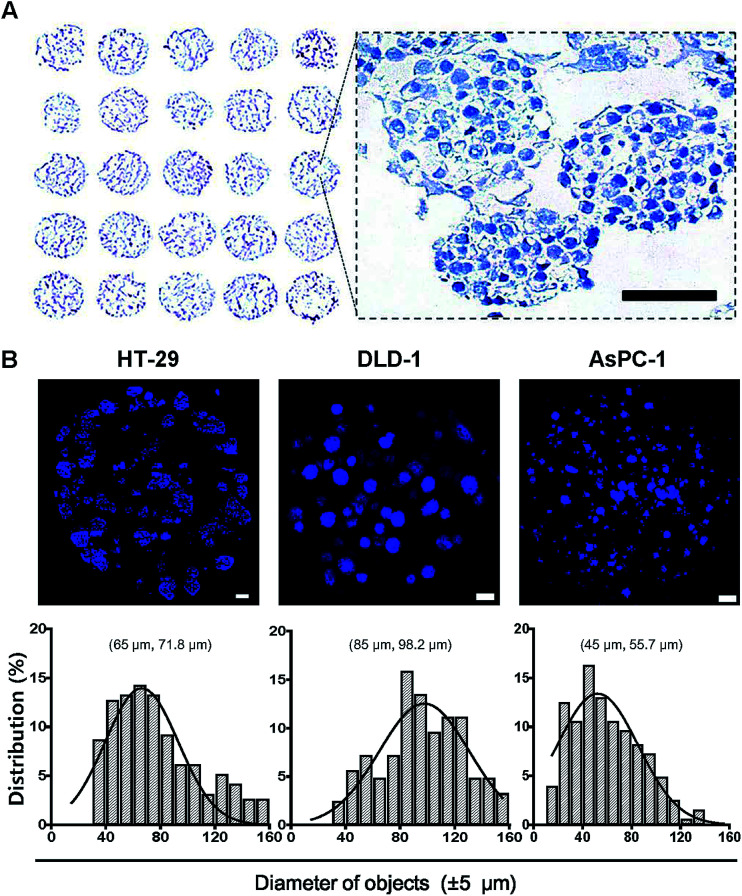
Fig. 3. Cross sectional images of tumor spheroids cultured on the 5 × 5 pillar array. HT-29, DLD-1 and AsPC-1 cells were cultured in alginate for 4 to 6 days to form spheroids on pillar tips and stained with DAPI. (A) Hematoxylin staining of HT-29 spheroids was done on a cryosections of 5 × 5 pillar array. The enlarged image shows the morphology of spheroids. Scale bar, 50 μm. (B) Sectional images and size distribution of tumor spheroids of HT-29, DLD-1, AsPC-1 cells. DAPI staining was performed either on cryosections (HT-29) or on pillar tips (DLD-1 and AsPC-1) followed by optical sectioning. Scale bar, 100 μm. Size distribution, (mode and median).

Fig. 3