. 2018 Jan 24;8(9):4494–4502. doi: 10.1039/c7ra09090k

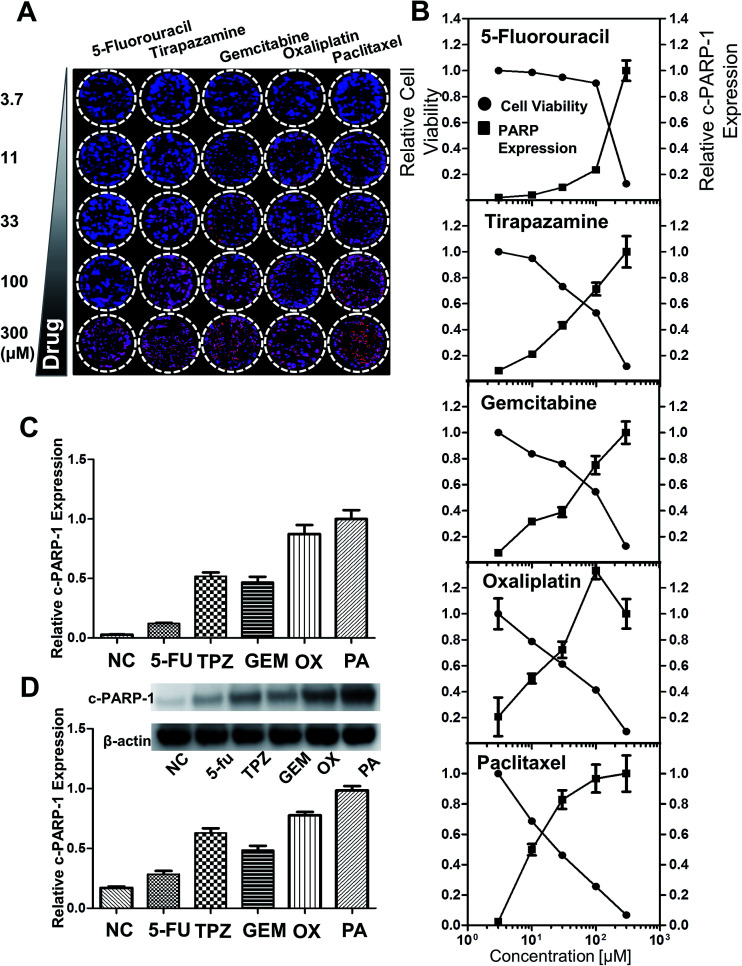
Fig. 6. Analysis of drug-induced cell death in HT-29 spheroids grown on the pillar array. Spheroids cultured for 6 days were exposed to 5-FU, TPZ, GEM, OX, and PA for 2 days, and subjected to cryosection and immunocytochemical staining. (A) Composite image of the 5 × 5 spheroid array, showing a concentration-dependent increase in c-PARP-1 expression (red) with DAPI (blue) for nucleus. (B) Relative cell viability and c-PARP-1 expression as a function of drug concentration. The fluorescent intensities were obtained from the array image in (A). (C) Relative c-PARP-1 expression obtained from the pillar array at 33 μM dosage of the five compounds. (D) Relative c-PARP-1 expression obtained from Western blots at 33 μM for the five compounds.

Fig. 6