. 2018 Jan 25;8(9):4624–4633. doi: 10.1039/c7ra13454a

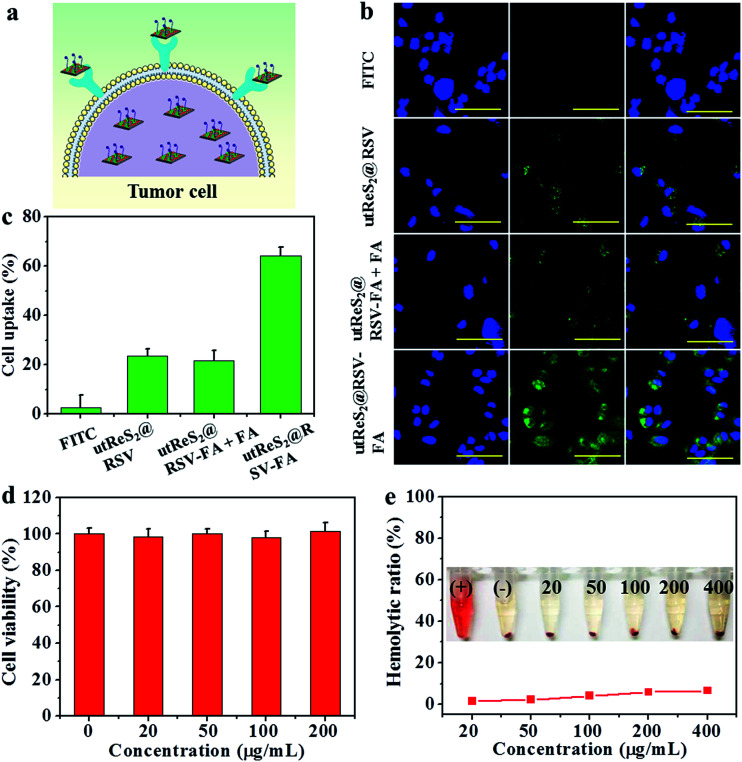
Fig. 5. (a) The schematic illustration of utReS2@RSV–FA target to tumor cell mediated by the FA receptor. (b) Fluorescence images of HepG2 cells after incubation with free FITC and utReS2@RSV, utReS2@RSV–FA + FA and utReS2@RSV–FA (labeled with FITC). Green and blue colors are FITC and DAPI fluorescence, respectively. Scale bar = 20 μm. (c) Flow cytometry quantitative results of cellular FITC fluorescence in HepG2 cells. (d) In vitro cytotoxicity against HepG2 cells treated with different concentrations of ReS2–FA. (e) Hemolytic ratio of RBCs after 1 hour incubation with utReS2@RSV–FA at different concentrations. The inset shows the photograph of water (+), PBS (−), and different concentrations of utReS2@RSV–FA treated RBCs.

Fig. 5