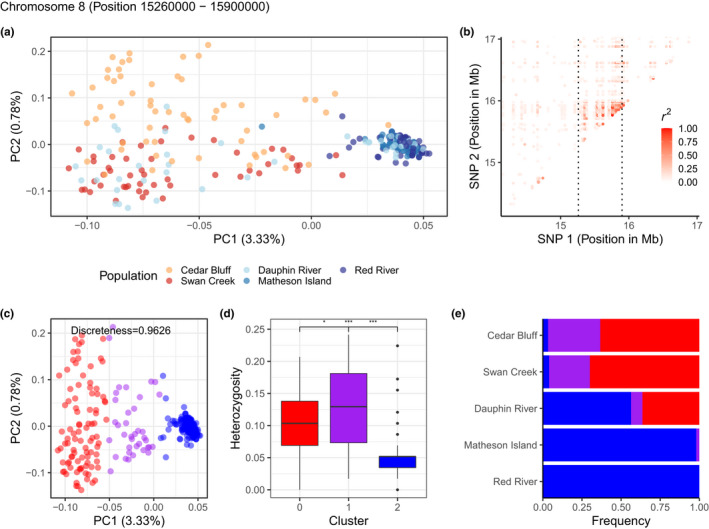
FIGURE 5.

Characterization of the putative inversion on chromosome 8 (15.26–15.90 Mb). (a) PCA based on 58 SNPs within the putative inversion, colored by site. (b) Linkage disequilibrium heatmap for SNPs within the putative inversion, with boundary of the putative inversion emphasized by dashed lines. (c) Clusters identified using k‐means clustering represent two homozygous groups, red and blue, and a heterozygous purple group. (d) Observed individual heterozygosity within each cluster identified. (e) Genotype frequency distribution by collection site and cluster. Bars represent the proportion of individuals from each k‐means cluster
