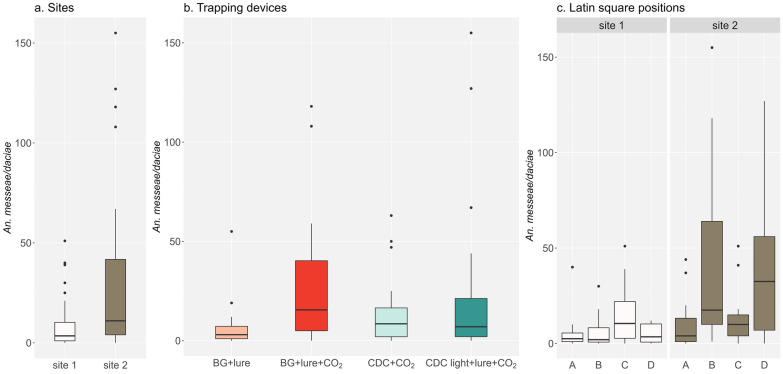
Fig. 2.
Box plots of Anopheles messeae/Anopheles daciae abundance distributions for each study site (a), type of trapping device (b), and Latin square position (c) for site 1 (farm) and site 2 (abandoned house). The middle, lower and upper hinges of the box plots represent the 50%, 25% and 75% quantiles, respectively. BG lure BG-Sentinel 2 (BG trap) baited with a BG-Lure cartridge, BG lure+CO2 BG trap baited with a BG-Lure cartridge and CO2, CDC+CO2 Centers for Disease Control and Prevention-like trap (CDC) baited with CO2, CDC light+lure+CO2 CDC trap used with light and baited with BG-Lure and CO2

