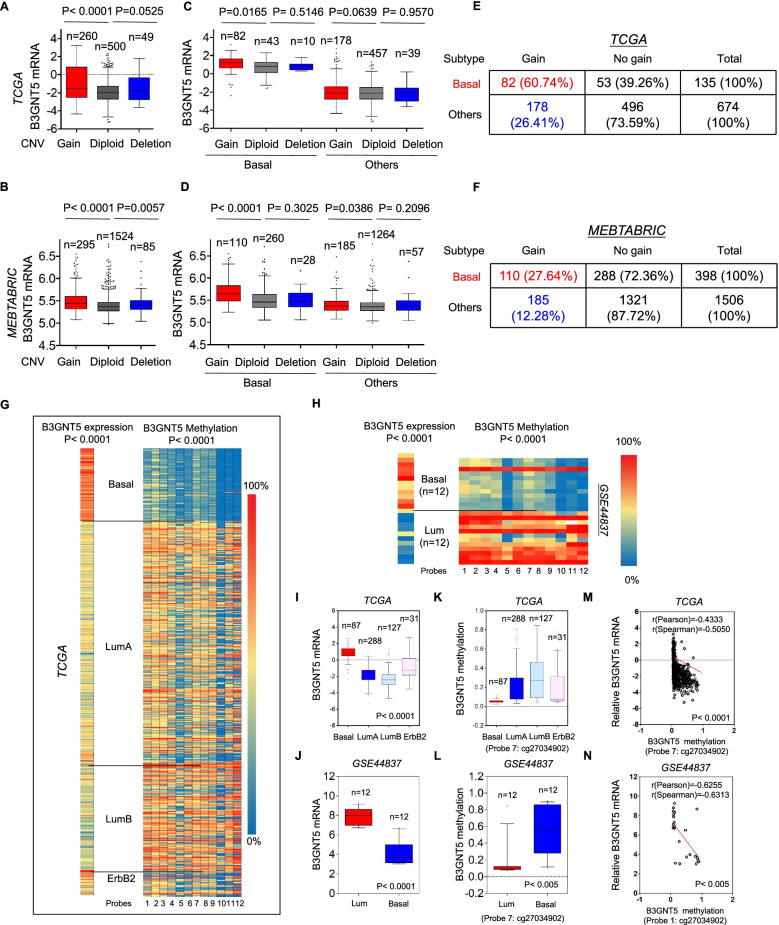
Fig. 2.
B3GNT5 overexpression correlated with its copy number amplification and promoter hypomethylation. A, B Box-plots indicated the correlation of B3GNT5 mRNA expression with its copy number variants status (gain, diploid and deletion) in breast cancer from the TCGA dataset (A) and MEBTABRIC dataset (B). C, D Box-plots showed the association of B3GNT5 mRNA level with copy number variants (gain, diploid and deletion) in different subtypes of breast cancer from the TCGA dataset (C) and MEBTABRIC dataset (D). E, F Analysis of the correlation between B3GNT5 mRNA expression and its copy number status (gain or no gain) in breast cancer from the TCGA dataset (E) and MEBTABRIC dataset (F). G, H Heat map displayed that B3GNT5 mRNA expression negatively correlated with promoter methylation of B3GNT5 using multiple 450 K probes in different subtypes of breast cancer (TGCA dataset) (G) and breast cancer cell lines (GSE44837 dataset) (H). I, J Box-plots indicated B3GNT5 mRNA expression in different subtypes of breast cancer (TGCA dataset) (I) and breast cancer cell lines (GSE44837 dataset) (J). K, L Box-plots indicated B3GNT5 promoter methylation in different subtypes of breast cancer (TGCA dataset) (K) and breast cancer cell lines (GSE44837 dataset) (L). M, N Analysis of the mRNA expression and methylation of B3GNT5 from the TCGA dataset (M) and GSE44837 dataset (N). The relative level of B3GNT5 mRNA was plotted against that of B3GNT5 methylation. Comparisons are made using the two-tailed Student’s t-test

