Fig. 1.
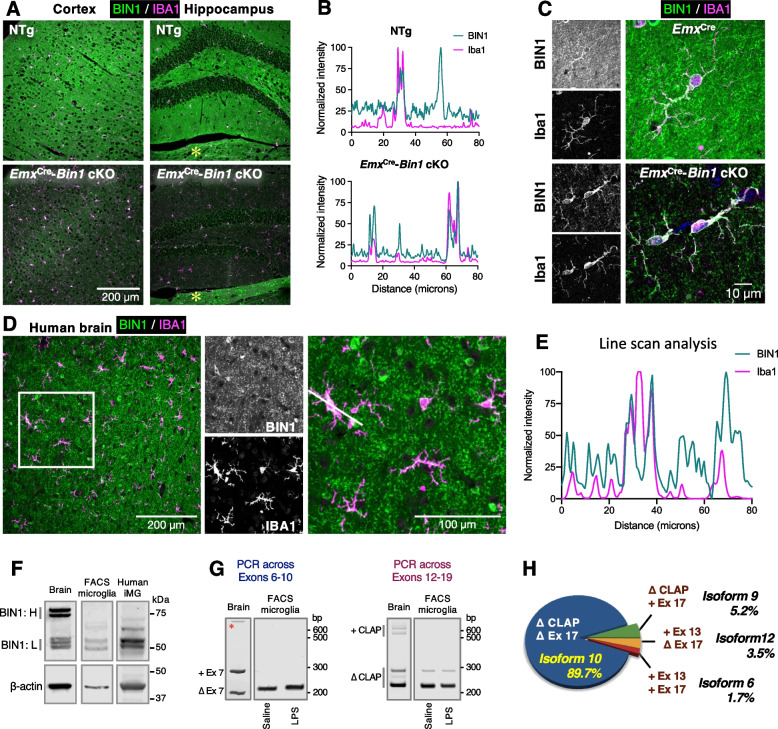
Characterization of BIN1 in the mouse brain and human iPSC-derived microglia. A Five μm-thick paraffin sections were stained with antibodies against BIN1 (green) and IBA1 (magenta). Images of the cortex and hippocampus from a WT animal show BIN1 expression in IBA1-positive microglia (top panel). By genetically ablating Bin1 expression from excitatory neurons and oligodendrocytes, microglial BIN1 expression is confirmed in Bin1 cKO mice (bottom panel). An asterisk indicates the expected unperturbed BIN1 expression in the thalamus beneath the dentate gyrus in the cKO brain [5]. B Line-scan analysis shows the concordance of BIN1 and IBA1 signal intensities in a subset of cells (in WT) and indicates the expression of BIN1 in IBA1+ microglia. The removal of BIN1 expression in excitatory neurons and oligodendrocytes demonstrates that the high-intensity profile of the microglial marker (IBA1) overlaps with that of BIN1, affirming microglial BIN1 expression. C Higher magnification images evidence BIN1 localization in the perinuclear regions of the microglial soma in Bin1 cKO and EmxCre littermates. Microglial BIN1 localization is readily apparent in the Bin1 cKO mouse brain, where BIN1 immunoreactivity could be seen permeating into cells’ ramifications (bottom panels). D Human post-mortem brain sections were stained with antibodies against BIN1 (green) and IBA1 (magenta). Overlapping morphological homogeneity of immunofluorescence unambiguously demonstrates BIN1 expression in human microglia. E Line-scan analysis exemplifies the overlapping expression of the two channels in D. Peaks in both channels represent microglial BIN1 expression. BIN1 only peaks reflect signals from oligodendrocyte cell bodies. The single isolated IBA1 peak suggests a lack of BIN1 expression in the nucleus of microglia. F Immunoblot analysis of BIN1 expression in whole-brain homogenates shows higher levels of BIN1 isoforms containing the CLAP domain (BIN1: H) and lower levels of BIN1:L isoforms. In contrast, FACS-isolated mouse microglia and human iPSC-derived iMG predominantly express BIN1 isoforms lacking the CLAP domain (BIN1: L). G RT-PCR analyses of FACS-isolated microglia demonstrate that exon 7 (left) and the CLAP domain (right) are excluded in the majority of microglial Bin1 transcripts. We detected no relative change in Bin1 isoforms following LPS administration (see Figs. S2A and S5H). An asterisk indicates a non-specific PCR product. H Microglial Bin1 isoforms generated by alternative splicing. Cloning and individual analysis of the PCR products allowed the Bin1 isoform frequency to be calculated. Approximately 90% of mouse microglial Bin1 transcripts code for isoform 10, with isoforms 9, 12, and 6 together, accounting for approximately 10% of Bin1 transcripts. Exon 7 (within the BAR domain), exon 11 (PI domain; see Fig. S3A), and exons 14-16 (within the CLAP domain) were not present in any microglial isoforms screened

