Fig. 7.
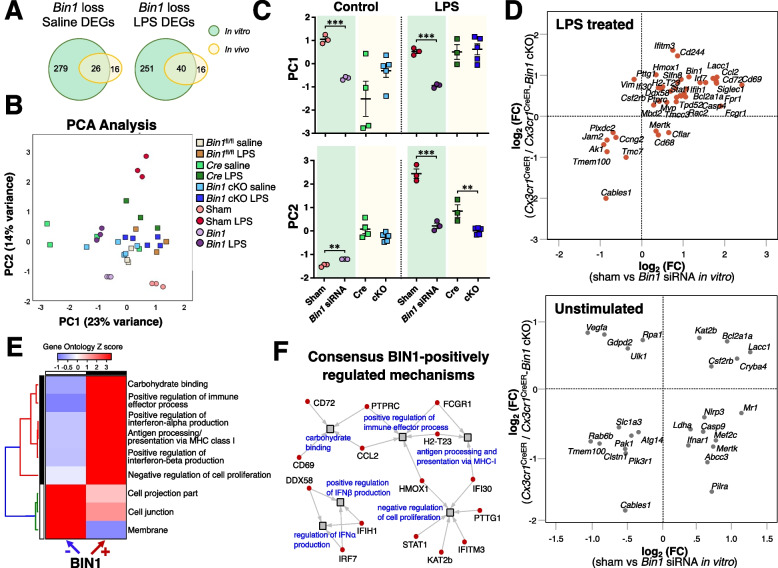
Concordance analysis between in vitro and in vivo NanoString datasets reveals a common pattern of microglial gene regulation by BIN1. A The Venn diagrams illustrate the overlapping DEGs in the in vitro and in vivo datasets under basal and LPS-stimulated conditions. B PCA demonstrates two principal components account for 37% of the variance in the combined dataset. C The PCA results show the similarities and differences between the in vitro and in vivo systems. D Whereas low concordance between in vitro and in vivo datasets was visualised from unstimulated microglia, LPS-stimulated cells showed higher concordance in gene expression between our model systems. E-F Gene ontology analysis of genes concordantly regulated in the in vitro and in vivo datasets found interferon- and membrane-related pathways to be regulated by BIN1

