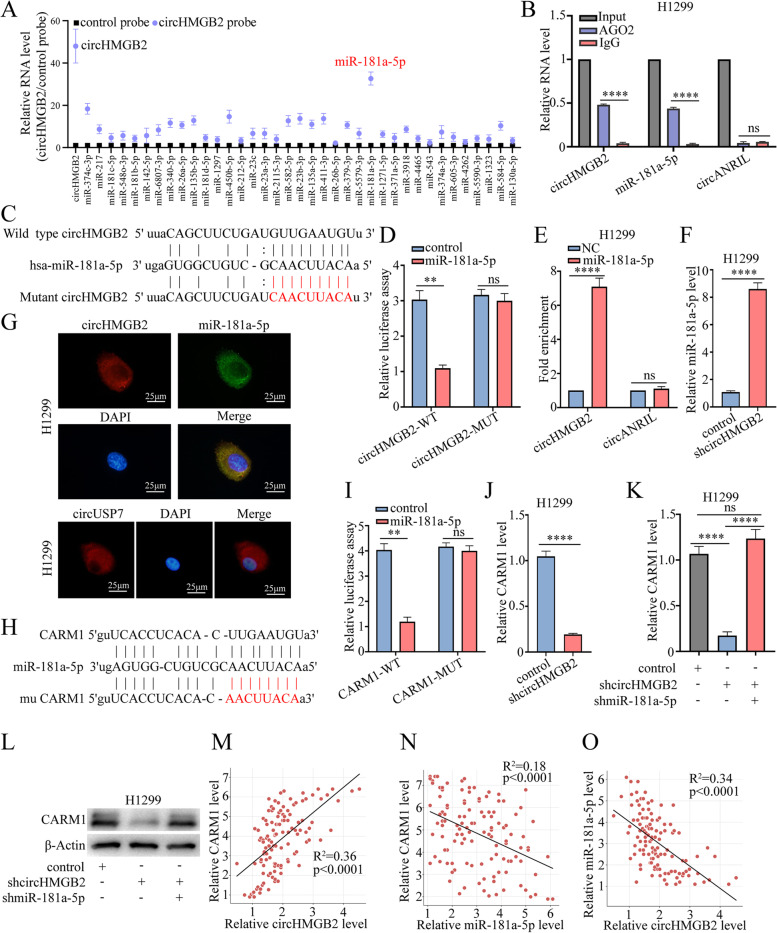
Fig. 3.
CircHMGB2 upregulates the expression of the downstream molecule CARM1 by sponging miR-181a-5p. A A circRIP assay was performed with a circHMGB2 probe in H1299 cells. B The RIP assay was performed using the anti-AGO2 antibody in H1299 cells. C The putative binding sites of circHMGB2 and miR-181a-5p. D The luciferase activity of circHMGB2 in HEK-293 T cells transfected with miR-181a-5p. E The RNA pulldown assay was performed with H1299 cells transfected with biotinylated miR-181a-5p. F The expression of miR-181a-5p was measured via qRT–PCR after the knockdown of circHMGB2 in H1299 cells. G FISH staining of circHMGB2 and miR-181a-5p in H1299 cells. circUSP7 as positive control H The putative binding sites of CARM1 and miR-181a-5p. I The luciferase activity of CARM1 was measured in HEK-293 T cells transfected with miR-181a-5p. J The expression of CARM1 was measured via qRT–PCR after the overexpression of circHMGB2. K The expression of CARM1 was measured using qRT–PCR after the dual knockdown of circHMGB2 and miR-181a-5p expression. L The expression of CARM1 was measured using western blotting after the dual knockdown of circHMGB2 and miR-181a-5p expression. M-O The relationships among the expression levels of circHMGB2, miR-181a-5p and CARM1 in 120 NSCLC tissues were assessed using qRT–PCR. Data are presented as the means ± SD; n = 3, **P < 0.01, ****P < 0.001, ns: not significant

