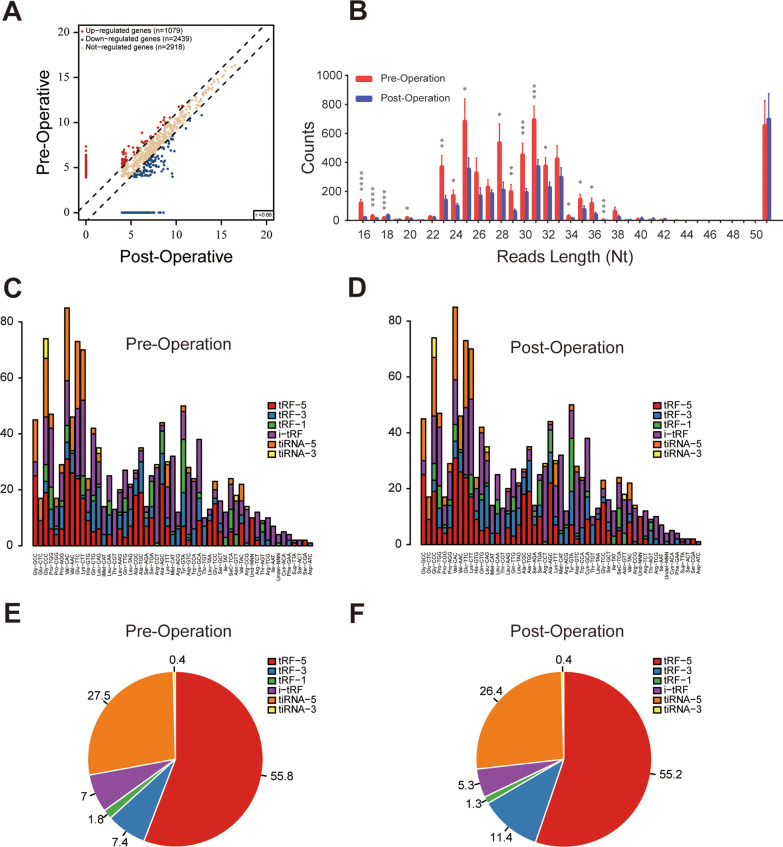
Fig. 1.
Characteristics of plasma tRF profiles in patients with NSCLC. A Scatter plot analysis revealed the differentially expressed tRFs between pre- and post-operation plasma samples. The red and blue points denote the significantly up- or down-regulated tRFs between two groups. B Length-wise distribution of tRFs between pre- and post-operation plasma samples in patients with NSCLC, showing the reads of most length-based tRF types in plasma were significantly decreased after removal of tumors. C, D Stacked plot for the number of tRFs and tiRNAs derived from the same tRNA: The X- and Y-axis represented the tRNAs and the number of different kinds of tRFs and tiRNAs derived from the same tRNA, respectively. E, F The pie charts indicated that tRF-5 is the major type of plasma tRFs in patients with NSCLC. *P < 0.05; **P < 0.01; ***P < 0.001; ****P < 0.0001

